[This is a Guest Diary by Eric Roldan, an ISC intern as part of the SANS.edu BACS program]
Through the expansion of Large Language Models (LLMs), cybersecurity has exploded with a variety of tools for both offensive and defensive purposes. A majority of software and cyber tools are integrating Artificial Intelligence (AI) solutions into their applications, largely in the form of chatbots, automation tools through Model Context Protocol (MCP), or ingestion to prompt response type interfaces.
An overlooked and underestimated aspect of AI that is slowly arising is the creation of bespoke user interfaces (UI). That is simply put — a UI that is created custom fit to the specific needs and data provided impromptu from the user. With the ability for these models to ingest large amounts of data, it can orchestrate the appropriate elements for a UI that will be tailored to the ingested dataset.
Rather than the user having to adjust their queries or layouts for the logs that they are analyzing, the LLM will determine the proper UI elements to give to the user. This allows the user to focus on analyzing rather than tool setup.
Over days of web traffic on the DShield webhoneypot, there are large variations of intent behind the interactions. Some days, some actors may focus only on scanning and recon. Other days may be heavy on stealing credentials or trying to get a web shell exploit.
As a regular user would try to identify patterns then use their discretion to find the next proper 'grep', 'jq', or other similar pattern recognizing POSIX tools, the LLM does the same.
Before this type of bespoke UIs in cyber analytics, analysts would have to spend extensive time and energy to understand what to look for and how to use the appropriate tools. With LLM's able to do this heavy lifting, more analysts will be able to recognize attacks on their web servers with little to no cyber experience.
When developers have to manage feature implementations, documentation updates, meetings (which are always productive of course…), and dreaded bugs – security and active monitoring become an afterthought. To make the internet a safer place, we have to lower the barrier to entry for recognizing web attacks.
Okay enough selling you on how much potential this has, let's talk about how it actually works.
It works like this: the system reads your DShield web honeypot log file, then a Python analyzer goes through the entries and turns them into a clean summary of what happened instead of dumping raw attacker text into the AI. That summary includes things like top IPs, top URLs, time patterns, and tags for probe/attack types such as WordPress probes, SSRF, path traversal, CGI abuse, and other recognizable patterns. Then Claude looks at the cleaned summary and writes a React dashboard component that fits the shape of the attack activity for that day, so the UI can change depending on whether the logs are mostly one big campaign or a mix of background internet noise.
The safe part is that the LLM never gets the raw malicious strings directly, and the generated UI never gets to run loose in the main page. Instead, the app serves the generated dashboard through a backend API, caches it so it does not constantly change, and renders it inside a sandboxed iframe. If the generated code is broken, the system validates it and falls back to a static dashboard. So the whole flow is basically: logs came in -> analyzer summarizes them -> Claude generates a matching UI -> frontend loads it safely and pulls chart data from the backend.
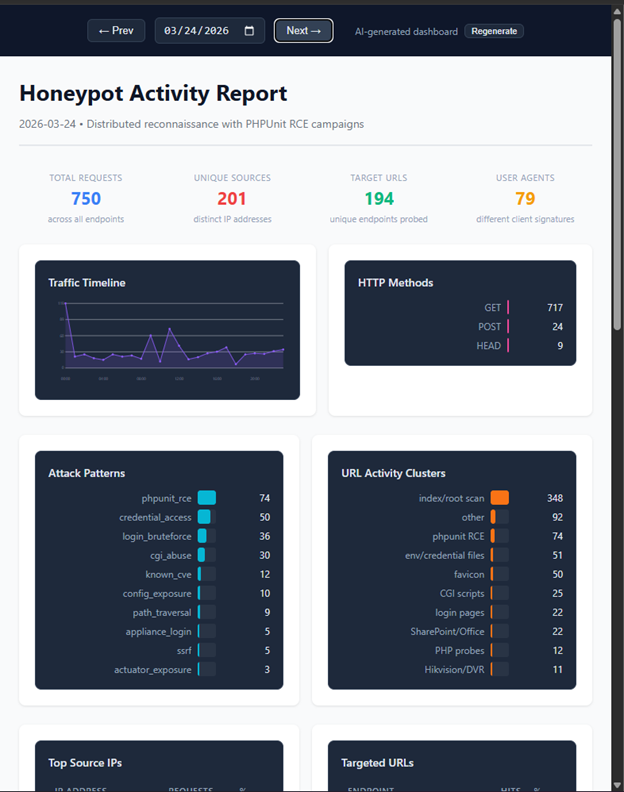
Let's take a look at some examples now! On days where there is more noise we do not see any dominant patterns highlighted on the UI
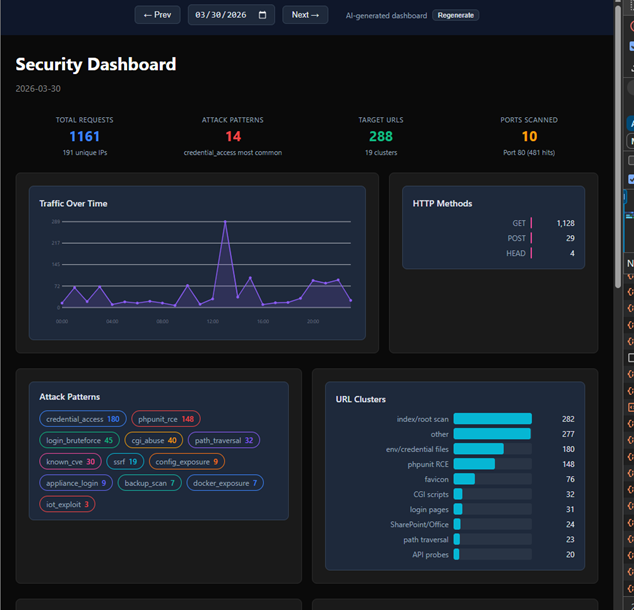
However, on days where there is a clear pattern from certain actors we see an immediate highlight…
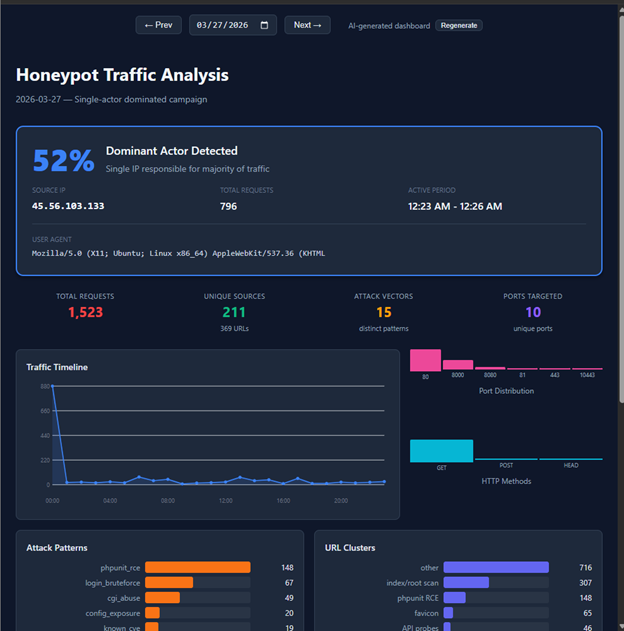
Furthermore, it is able to recognize and highlight attack signatures that were most obvious (or would be obvious to an experienced analyst) at the very top of the UI’s dashboard

There are sometimes some interesting quirks like the LLM creating a dashboard with light mode instead of dark mode.
Nonetheless it is interesting to see how the LLM adapts to each day’s attack logs. I imagine if I could “vibe code” this idea in a few hours, it could become a full-blown platform and toolkit for major organizations and analysts. So yea…I didn’t write the code for all this madness, I simply took a problem that I constantly face when looking at attack logs – what is it that I’m actually looking for? And created a unique bespoke UI for each day’s scenario.
Shout out to Claude Code for agentically writing the repo which can be found here.
Shout out to ChatGPT for helping me write the ‘how it works’ section of this blog.
And a special shout out to my Internship mentor Guy Bruneau for helping me think bigger in terms of recognizing interesting attacks on my webhoneypot.
Be sure to subscribe to my youtube channel for more edgy tech content and cyber insights.
youtube.com/@gnarcoding
[1] https://github.com/gnarcoding/bespoke-ui-cyber-analytics/
[2] https://isc.sans.edu/tools/honeypot/
[3] https://www.sans.edu/cyber-security-programs/bachelors-degree/
———–
Guy Bruneau IPSS Inc.
My GitHub Page
Twitter: GuyBruneau
gbruneau at isc dot sans dot edu
(c) SANS Internet Storm Center. https://isc.sans.edu Creative Commons Attribution-Noncommercial 3.0 United States License.