As we come to towards the end of 2023, we are excited to announce the general availability of PowerShell 7.4!
This release is built on .NET 8 and similarly,
is our latest Long Term Support (LTS) release supported for 3 years.
We want to thank our community and many contributors for their invaluable help identifying issues,
engaging in discussions in our repository, providing fixes and new features,
and helping us ship a high quality release!
How do I get it?
Since PowerShell 7 is supported on Windows, Linux, and macOS, there are a variety of ways to get it.
If you installed the previous PowerShell 7 stable release (7.3) via the Windows Store or MSI (and opted into Microsoft Update),
you will be automatically updated to 7.4 GA.
What’s new?
This release continues to focus on enhancing the shell experience and addressing
commonly reported customer and partner issues.
A detailed report of What’s New
is available in our documentation or via the WhatsNew
module.
Here are a few highlights:
PSResourceGet 1.0
This release includes PSResourceGet, which itself
was made generally available earlier this year.
PSResourceGet replaces PowerShellGet (although the two work side-by-side for legacy scripts) and where we will invest future
enhancements to the PowerShell module ecosystem.
This release focuses on a new codebase that is more maintainable and also provides better performance.
In addition, this module uses a different set of cmdlets to allow for breaking changes that provide a more intuitive user experience.
PSReadLine 2.3
This release includes the latest PSReadLine release
that contains a number of enhancements and bug fixes.
New stable features
The PowerShell Committee reviewed the experimental features we’ve had in the preview releases along with
community feedback (issues) and telemetry indicating the feature was used and not disabled and decided that
the following features were ready to be deemed stable for this release:
PSConstrainedAuditLogging
This feature enables PowerShell 7 to adhere to WDAC Audit mode and log events into the Windows Event Log.
In this mode, PowerShell runs scripts in Full Language Mode, but logs events if there would be
a difference in behavior in System Lockdown mode.
This makes it easier for administrators to deploy PowerShell 7 in environments that have System Lockdown mode enabled
by understanding what scripts would need to be modified to run in that mode.
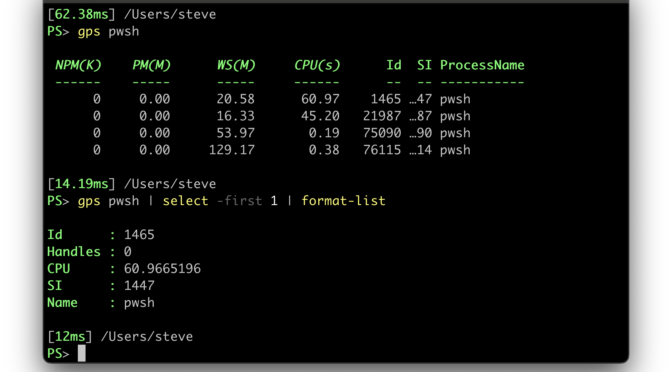
PSCustomTableHeaderLabelDecoration
A common feedback from users is that with objects rendered as tables, it was not clear when a header
label was not a property of the object.
For example, when using Get-Process, you’ll see a column with the header CPU(s) to indicate the
amount of cpu seconds used by that process.
However, if you tried to access that property, you would find it’s actually called just CPU and the (s)
was added to the header to indicate that it was in seconds.
This new feature allows you to decorate the header label to make it clear that it is not a property of the object.
The default decoration simply renders the header label in italics.
PSWindowsNativeCommandArgPassing
This is continuation of a feature we first added in 7.3.
A major difference between Windows and non-Windows is how arguments are parsed particularly when quotes are involved.
As more Open Source command-line tools are being used on Windows, we want to make sure that PowerShell
can pass arguments to those tools in a way that works as expected.
However, many legacy command-line tools on Windows do not handle arguments in the industry standard way.
As such, a Windows mode for $PSNativeCommandArgumentPassing special cases some known tools to fallback to how
it worked with Windows PowerShell while modern tools the new Standard mode.
A Legacy mode is available for those that need to support legacy tools that do not work with the Windows mode.
PSNativeCommandErrorActionPreference
This is another continuation of a feature we first added in 7.3.
This feature allows you to treat a non-zero exit code from a native command as an ErrorRecord that would come from a cmdlet.
This allows you to set $ErrorActionPreference to Stop and have PowerShell stop execution whether a cmdlet had an error
or a native command had a non-zero exit code.
This simplifies scripts that previously would have to check $LASTEXITCODE after execution of a native command or wrap it in a helper function.
PSNativeCommandPreserveBytePipe
This feature allows you to preserve the byte stream when piping to or from a native command.
Previously, all streams were converted to strings when piping to or from a native command and thus lost the original byte stream.
This is useful for tools that expect binary input such as tar or zip.
There are still a number of experimental featues in this release pending additional user feedback before we can promote them to stable.
For example, we continue to iterate on the Feedback Provider
model as we get more feedback from users and partners who implement it.
Breaking changes
There are a few Breaking Changes
in this release that you should be aware of although we expect them to be rare.
One that could affect some users is the new -ProgressAction common parameter.
Similar to other common parameters, the new -ProgressAction parameter is automatically available to cmdlets and advanced functions.
This parameter allows you to control how progress is reported for a cmdlet or advanced function call.
Previously, you would have to set $ProgressPreference to SilentlyContinue to suppress progress and then restore it to its previous value.
What’s Next?
We will continue to focus on making PowerShell a great shell environment next year with PowerShell 7.5.
As usual, we’ll continue to address issues and bugs reported by our community and partners as well as adopt the latest .NET 9 preview releases.
Specific team investments will be discussed in a separate blog post early next year.
Thanks again to our community and partners for their continued support and feedback!
The Federal Bureau of Investigation (FBI) and Cybersecurity and Infrastructure Security Agency (CISA) are releasing this joint Cybersecurity Advisory (CSA) in response to recent activity by Scattered Spider threat actors against the commercial facilities sectors and subsectors. This advisory provides tactics, techniques, and procedures (TTPs) obtained through FBI investigations as recently as November 2023.
Scattered Spider is a cybercriminal group that targets large companies and their contracted information technology (IT) help desks. Scattered Spider threat actors, per trusted third parties, have typically engaged in data theft for extortion and have also been known to utilize BlackCat/ALPHV ransomware alongside their usual TTPs.
The FBI and CISA encourage critical infrastructure organizations to implement the recommendations in the Mitigations section of this CSA to reduce the likelihood and impact of a cyberattack by Scattered Spider actors.
Note: This advisory uses the MITRE ATT&CK for Enterprise framework, version 14. See the MITRE ATT&CK® Tactics and Techniques section for a table of the threat actors’ activity mapped to MITRE ATT&CK tactics and techniques. For assistance with mapping malicious cyber activity to the MITRE ATT&CK framework, see CISA and MITRE ATT&CK’s Best Practices for MITRE ATT&CK Mapping and CISA’s Decider Tool.
Overview
Scattered Spider (also known as Starfraud, UNC3944, Scatter Swine, and Muddled Libra) engages in data extortion and several other criminal activities.[1] Scattered Spider threat actors are considered experts in social engineering and use multiple social engineering techniques, especially phishing, push bombing, and subscriber identity module (SIM) swap attacks, to obtain credentials, install remote access tools, and/or bypass multi-factor authentication (MFA). According to public reporting, Scattered Spider threat actors have [2],[3],[4]:
Posed as company IT and/or helpdesk staff using phone calls or SMS messages to obtain credentials from employees and gain access to the network [T1598],[T1656].
Posed as company IT and/or helpdesk staff to direct employees to run commercial remote access tools enabling initial access [T1204],[T1219],[T1566].
Posed as IT staff to convince employees to share their one-time password (OTP), an MFA authentication code.
Sent repeated MFA notification prompts leading to employees pressing the “Accept” button (also known as MFA fatigue) [T1621].[5]
Convinced cellular carriers to transfer control of a targeted user’s phone number to a SIM card they controlled, gaining control over the phone and access to MFA prompts.
Monetized access to victim networks in numerous ways including extortion enabled by ransomware and data theft [T1657].
After gaining access to networks, FBI observed Scattered Spider threat actors using publicly available, legitimate remote access tunneling tools. Table 1 details a list of legitimate tools Scattered Spider, repurposed and used for their criminal activity. Note: The use of these legitimate tools alone is not indicative of criminal activity. Users should review the Scattered Spider indicators of compromise (IOCs) and TTPs discussed in this CSA to determine whether they have been compromised.
Table 1: Legitimate Tools Used by Scattered Spider
Tool
Intended Use
Fleetdeck.io
Enables remote monitoring and management of systems.
Level.io
Enables remote monitoring and management of systems.
Enables remote access to a local web server by tunneling over the internet.
Pulseway
Enables remote monitoring and management of systems.
Screenconnect
Enables remote connections to network devices for management.
Splashtop
Enables remote connections to network devices for management.
Tactical.RMM
Enables remote monitoring and management of systems.
Tailscale
Provides virtual private networks (VPNs) to secure network communications.
Teamviewer
Enables remote connections to network devices for management.
In addition to using legitimate tools, Scattered Spider also uses malware as part of its TTPs. See Table 2 for some of the malware used by Scattered Spider.
Steals information including login credentials [TA0006], browser history [T1217], cookies [T1539], and other data.
VIDAR Stealer
Steals information including login credentials, browser history, cookies, and other data.
Scattered Spider threat actors have historically evaded detection on target networks by using living off the land techniques and allowlisted applications to navigate victim networks, as well as frequently modifying their TTPs.
Observably, Scattered Spider threat actors have exfiltrated data [TA0010] after gaining access and threatened to release it without deploying ransomware; this includes exfiltration to multiple sites including U.S.-based data centers and MEGA[.]NZ [T1567.002].
Recent Scattered Spider TTPs
New TTP – File Encryption
More recently, the FBI has identified Scattered Spider threat actors now encrypting victim files after exfiltration [T1486]. After exfiltrating and/or encrypting data, Scattered Spider threat actors communicate with victims via TOR, Tox, email, or encrypted applications.
Reconnaissance, Resource Development, and Initial Access
Scattered Spider intrusions often begin with broad phishing [T1566] and smishing [T1660] attempts against a target using victim-specific crafted domains, such as the domains listed in Table 3 [T1583.001].
Table 3: Domains Used by Scattered Spider Threat Actors
Domains
victimname-sso[.]com
victimname-servicedesk[.]com
victimname-okta[.]com
In most instances, Scattered Spider threat actors conduct SIM swapping attacks against users that respond to the phishing/smishing attempt. The threat actors then work to identify the personally identifiable information (PII) of the most valuable users that succumbed to the phishing/smishing, obtaining answers for those users’ security questions. After identifying usernames, passwords, PII [T1589], and conducting SIM swaps, the threat actors then use social engineering techniques [T1656] to convince IT help desk personnel to reset passwords and/or MFA tokens [T1078.002],[T1199],[T1566.004] to perform account takeovers against the users in single sign-on (SSO) environments.
Execution, Persistence, and Privilege Escalation
Scattered Spider threat actors then register their own MFA tokens [T1556.006],[T1606] after compromising a user’s account to establish persistence [TA0003]. Further, the threat actors add a federated identity provider to the victim’s SSO tenant and activate automatic account linking [T1484.002]. The threat actors are then able to sign into any account by using a matching SSO account attribute. At this stage, the Scattered Spider threat actors already control the identity provider and then can choose an arbitrary value for this account attribute. As a result, this activity allows the threat actors to perform privileged escalation [TA0004] and continue logging in even when passwords are changed [T1078]. Additionally, they leverage common endpoint detection and response (EDR) tools installed on the victim networks to take advantage of the tools’ remote-shell capabilities and executing of commands which elevates their access. They also deploy remote monitoring and management (RMM) tools [T1219] to then maintain persistence.
Discovery, Lateral Movement, and Exfiltration
Once persistence is established on a target network, Scattered Spider threat actors often perform discovery, specifically searching for SharePoint sites [T1213.002], credential storage documentation [T1552.001], VMware vCenter infrastructure [T1018], backups, and instructions for setting up/logging into Virtual Private Networks (VPN) [TA0007]. The threat actors enumerate the victim’s Active Directory (AD), perform discovery and exfiltration of victim’s code repositories [T1213.003], code-signing certificates [T1552.004], and source code [T1083],[TA0010]. Threat actors activate Amazon Web Services (AWS) Systems Manager Inventory [T1538] to discover targets for lateral movement [TA0007],[TA0008], then move to both preexisting [T1021.007] and actor-created [T1578.002] Amazon Elastic Compute Cloud (EC2) instances. In instances where the ultimate goal is data exfiltration, Scattered Spider threat actors use actor-installed extract, transform, and load (ETL) tools [T1648] to bring data from multiple data sources into a centralized database [T1074],[T1530]. According to trusted third parties, where more recent incidents are concerned, Scattered Spider threat actors may have deployed BlackCat/ALPHV ransomware onto victim networks—thereby encrypting VMware Elastic Sky X integrated (ESXi) servers [T1486].
To determine if their activities have been uncovered and maintain persistence, Scattered Spider threat actors often search the victim’s Slack, Microsoft Teams, and Microsoft Exchange online for emails [T1114] or conversations regarding the threat actor’s intrusion and any security response. The threat actors frequently join incident remediation and response calls and teleconferences, likely to identify how security teams are hunting them and proactively develop new avenues of intrusion in response to victim defenses. This is sometimes achieved by creating new identities in the environment [T1136] and is often upheld with fake social media profiles [T1585.001] to backstop newly created identities.
MITRE ATT&CK TACTICS AND TECHNIQUES
See Tables 4 through 17 for all referenced threat actor tactics and techniques in this advisory.
Scattered Spider threat actors impersonating helpdesk personnel direct employees to run commercial remote access tools thereby enabling access to the victim’s network.
Upon gaining access to a targeted network, Scattered Spider threat actors seek out SharePoint sites, credential storage documentation, VMware vCenter, infrastructure backups and enumerate AD to identify useful information to support further operations.
Impersonating helpdesk personnel, Scattered Spider threat actors direct employees to run commercial remote access tools thereby enabling access to and command and control of the victim’s network.
Scattered Spider threat actors leverage third-party software to facilitate lateral movement and maintain persistence on a target organization’s network.
Scattered Spider threat actors monetized access to victim networks in numerous ways including extortion-enabled ransomware and data theft.
MITIGATIONS
These mitigations apply to all critical infrastructure organizations and network defenders. The FBI and CISA recommend that software manufactures incorporate secure-by-design and -default principles and tactics into their software development practices limiting the impact of ransomware techniques, thus, strengthening the secure posture for their customers.
The FBI and CISA recommend organizations implement the mitigations below to improve your organization’s cybersecurity posture based on the threat actor activity and to reduce the risk of compromise by Scattered Spider threat actors. These mitigations align with the Cross-Sector Cybersecurity Performance Goals (CPGs) developed by CISA and the National Institute of Standards and Technology (NIST). The CPGs provide a minimum set of practices and protections that CISA and NIST recommend all organizations implement. CISA and NIST based the CPGs on existing cybersecurity frameworks and guidance to protect against the most common and impactful threats, tactics, techniques, and procedures. Visit CISA’s Cross-Sector Cybersecurity Performance Goals for more information on the CPGs, including additional recommended baseline protections.
Implement application controls to manage and control execution of software, including allowlisting remote access programs. Application controls should prevent installation and execution of portable versions of unauthorized remote access and other software. A properly configured application allowlisting solution will block any unlisted application execution. Allowlisting is important because antivirus solutions may fail to detect the execution of malicious portable executables when the files use any combination of compression, encryption, or obfuscation.
Reduce threat of malicious actors using remote access tools by:
Auditing remote access tools on your network to identify currently used and/or authorized software.
Reviewing logs for execution of remote access software to detect abnormal use of programs running as a portable executable [CPG 2.T].
Using security software to detect instances of remote access software being loaded only in memory.
Requiring authorized remote access solutions to be used only from within your network over approved remote access solutions, such as virtual private networks (VPNs) or virtual desktop interfaces (VDIs).
Blocking both inbound and outbound connections on common remote access software ports and protocols at the network perimeter.
Implementing FIDO/WebAuthn authentication or Public Key Infrastructure (PKI)-based MFA. These MFA implementations are resistant to phishing and not suspectable to push bombing or SIM swap attacks, which are techniques known to be used by Scattered Spider actors. See CISA’s fact sheet Implementing Phishing-Resistant MFA for more information.
Strictly limit the use of Remote Desktop Protocol (RDP) and other remote desktop services. If RDP is necessary, rigorously apply best practices, for example [CPG 2.W]:
Audit the network for systems using RDP.
Close unused RDP ports.
Enforce account lockouts after a specified number of attempts.
In addition, the authoring authorities of this CSA recommend network defenders apply the following mitigations to limit potential adversarial use of common system and network discovery techniques, and to reduce the impact and risk of compromise by ransomware or data extortion actors:
Implement a recovery plan to maintain and retain multiple copies of sensitive or proprietary data and servers in a physically separate, segmented, and secure location (i.e., hard drive, storage device, the cloud).
Maintain offline backups of data and regularly maintain backup and restoration (daily or weekly at minimum). By instituting this practice, an organization limits the severity of disruption to its business practices [CPG 2.R].
Require all accounts with password logins (e.g., service account, admin accounts, and domain admin accounts) to comply with NIST’s standards for developing and managing password policies.
Use longer passwords consisting of at least eight characters and no more than 64 characters in length [CPG 2.B].
Store passwords in hashed format using industry-recognized password managers.
Add password user “salts” to shared login credentials.
Refrain from requiring password changes more frequently than once per year. Note: NIST guidance suggests favoring longer passwords instead of requiring regular and frequent password resets. Frequent password resets are more likely to result in users developing password “patterns” cyber criminals can easily decipher.
Require administrator credentials to install software.
Require phishing-resistant multifactor authentication (MFA) for all services to the extent possible, particularly for webmail, virtual private networks (VPNs), and accounts that access critical systems [CPG 2.H].
Keep all operating systems, software, and firmware up to date. Timely patching is one of the most efficient and cost-effective steps an organization can take to minimize its exposure to cybersecurity threats. Prioritize patching known exploited vulnerabilities in internet-facing systems [CPG 1.E].
Segment networks to prevent the spread of ransomware. Network segmentation can help prevent the spread of ransomware by controlling traffic flows between—and access to—various subnetworks and by restricting adversary lateral movement [CPG 2.F].
Identify, detect, and investigate abnormal activity and potential traversal of the indicated ransomware with a networking monitoring tool. To aid in detecting the ransomware, implement a tool that logs and reports all network traffic and activity, including lateral movement, on a network. Endpoint detection and response (EDR) tools are particularly useful for detecting lateral connections as they have insight into common and uncommon network connections for each host [CPG 3.A].
Install, regularly update, and enable real time detection for antivirus software on all hosts.
Consider adding an email banner to emails received from outside your organization [CPG 2.M].
Disable hyperlinks in received emails.
Ensure all backup data is encrypted, immutable (i.e., ensure backup data cannot be altered or deleted), and covers the entire organization’s data infrastructure [CPG 2.K, 2.L, 2.R].
VALIDATE SECURITY CONTROLS
In addition to applying mitigations, FBI and CISA recommend exercising, testing, and validating your organization’s security program against the threat behaviors mapped to the MITRE ATT&CK for Enterprise framework in this advisory. The FBI and CISA recommend testing your existing security controls inventory to assess how they perform against the ATT&CK techniques described in this advisory.
To get started:
Select an ATT&CK technique described in this advisory (see Tables 4-17).
Align your security technologies against the technique.
Test your technologies against the technique.
Analyze your detection and prevention technologies’ performance.
Repeat the process for all security technologies to obtain a set of comprehensive performance data.
Tune your security program, including people, processes, and technologies, based on the data generated by this process.
FBI and CISA recommend continually testing your security program, at scale, in a production environment to ensure optimal performance against the MITRE ATT&CK techniques identified in this advisory.
REPORTING
FBI and CISA are seeking any information that can be shared, to include a sample ransom note, communications with Scattered Spider group actors, Bitcoin wallet information, decryptor files, and/or a benign sample of an encrypted file. FBI and CISA do not encourage paying ransom as payment does not guarantee victim files will be recovered. Furthermore, payment may also embolden adversaries to target additional organizations, encourage other criminal actors to engage in the distribution of ransomware, and/or fund illicit activities. Regardless of whether you or your organization have decided to pay the ransom, FBI and CISA urge you to promptly report ransomware incidents to a local FBI Field Office, report the incident to the FBI Internet Crime Complaint Center (IC3) at IC3.gov, or CISA via CISA’s 24/7 Operations Center (report@cisa.gov or 888-282-0870).
The information in this report is being provided “as is” for informational purposes only. FBI and CISA do not endorse any commercial entity, product, company, or service, including any entities, products, or services linked within this document. Any reference to specific commercial entities, products, processes, or services by service mark, trademark, manufacturer, or otherwise, does not constitute or imply endorsement, recommendation, or favoring by FBI and CISA.
Note: This joint Cybersecurity Advisory (CSA) is part of an ongoing #StopRansomware effort to publish advisories for network defenders detailing various ransomware variants and ransomware threat actors. These #StopRansomware advisories include recently and historically observed tactics, techniques, and procedures (TTPs) and indicators of compromise (IOCs) to help organizations protect against ransomware. Visit stopransomware.gov to see all #StopRansomware advisories and to learn more about other ransomware threats and no-cost resources.
The Federal Bureau of Investigation (FBI), Cybersecurity and Infrastructure Security Agency (CISA), and the Multi-State Information Sharing and Analysis Center (MS-ISAC) are releasing this joint CSA to disseminate known Rhysida ransomware IOCs and TTPs identified through investigations as recently as September 2023. Rhysida—an emerging ransomware variant—has predominately been deployed against the education, healthcare, manufacturing, information technology, and government sectors since May 2023. The information in this CSA is derived from related incident response investigations and malware analysis of samples discovered on victim networks.
FBI, CISA, and the MS-ISAC encourage organizations to implement the recommendations in the Mitigations section of this CSA to reduce the likelihood and impact of Rhysida ransomware and other ransomware incidents.
Note: This advisory uses the MITRE ATT&CK® for Enterprise framework, version 14. See the ATT&CK Tactics and Techniques section for tables mapped to the threat actors’ activity.
Overview
Threat actors leveraging Rhysida ransomware are known to impact “targets of opportunity,” including victims in the education, healthcare, manufacturing, information technology, and government sectors. Open source reporting details similarities between Vice Society (DEV-0832)[1] activity and the actors observed deploying Rhysida ransomware. Additionally, open source reporting[2] has confirmed observed instances of Rhysida actors operating in a ransomware-as-a-service (RaaS) capacity, where ransomware tools and infrastructure are leased out in a profit-sharing model. Any ransoms paid are then split between the group and the affiliates.
For additional information on Vice Society actors and associated activity, see the joint CSA #StopRansomware: Vice Society.
Initial Access
Rhysida actors have been observed leveraging external-facing remote services to initially access and persist within a network. Remote services, such as virtual private networks (VPNs), allow users to connect to internal enterprise network resources from external locations. Rhysida actors have commonly been observed authenticating to internal VPN access points with compromised valid credentials [T1078], notably due to organizations lacking MFA enabled by default. Additionally, actors have been observed exploiting Zerologon (CVE-2020-1472)—a critical elevation of privileges vulnerability in Microsoft’s Netlogon Remote Protocol [T1190]—as well as conducting successful phishing attempts [T1566]. Note: Microsoft released a patch for CVE-2020-1472 on August 11, 2020.[3]
Living off the Land
Analysis identified Rhysida actors using living off the land techniques, such as creating Remote Desktop Protocol (RDP) connections for lateral movement [T1021.001], establishing VPN access, and utilizing PowerShell [T1059.001]. Living off the land techniques include using native (built into the operating system) network administration tools to perform operations. This allows the actors to evade detection by blending in with normal Windows systems and network activities.
Ipconfig [T1016], whoami [T1033], nltest [T1482], and several net commands have been used to enumerate victim environments and gather information about domains. In one instance of using compromised credentials, actors leveraged net commands within PowerShell to identify logged-in users and performed reconnaissance on network accounts within the victim environment. Note: The following commands were not performed in the exact order listed.
Analysis of the master file table (MFT)[4] identified the victim system generated the ntuser.dat registry hive, which was created when the compromised user logged in to the system for the first time. This was considered anomalous due to the baseline of normal activity for that particular user and system. Note: The MFT resides within the New Technology File System (NTFS) and houses information about a file including its size, time and date stamps, permissions, and data content.
Leveraged Tools
Table 1 lists legitimate tools Rhysida actors have repurposed for their operations. The legitimate tools listed in this joint CSA are all publicly available. Use of these tools should not be attributed as malicious without analytical evidence to support they are used at the direction of or controlled by threat actors.
Disclaimer: Organizations are encouraged to investigate and vet use of these tools prior to performing remediation actions.
Table 1: Tools Leveraged by Rhysida Actors
Name
Description
cmd.exe
The native command line prompt utility.
PowerShell.exe
A native command line tool used to start a Windows PowerShell session in a Command Prompt window.
PsExec.exe
A tool included in the PsTools suite used to execute processes remotely. Rhysida actors heavily leveraged this tool for lateral movement and remote execution.
mstsc.exe
A native tool that establishes an RDP connection to a host.
PuTTY.exe
Rhysida actors have been observed creating Secure Shell (SSH) PuTTy connections for lateral movement. In one example, analysis of PowerShell console host history for a compromised user account revealed Rhysida actors leveraged PuTTy to remotely connect to systems via SSH [T1021.004].
PortStarter
A back door script written in Go that provides functionality for modifying firewall settings and opening ports to pre-configured command and control (C2) servers.[1]
secretsdump
A script used to extract credentials and other confidential information from a system. Rhysida actors have been observed using this for NTDS dumping [T1003.003] in various instances.
ntdsutil.exe
A standard Windows tool used to interact with the NTDS database. Rhysida actors used this tool to extract and dump the NTDS.dit database from the domain controller containing hashes for all Active Directory (AD) users.
Note: It is strongly recommended that organizations conduct domain-wide password resets and double Kerberos TGT password resets if any indication is found that the NTDS.dit file was compromised.
AnyDesk
A common software that can be maliciously used by threat actors to obtain remote access and maintain persistence [T1219]. AnyDesk also supports remote file transfer.
wevtutil.exe
A standard Windows Event Utility tool used to view event logs. Rhysida actors used this tool to clear a significant number of Windows event logs, including system, application, and security logs [T1070.001].
PowerView
A PowerShell tool used to gain situational awareness of Windows domains. Review of PowerShell event logs identified Rhysida actors using this tool to conduct additional reconnaissance-based commands and harvest credentials.
Rhysida Ransomware Characteristics
Execution
In one investigation, Rhysida actors created two folders in the C: drive labeled in and out, which served as a staging directory (central location) for hosting malicious executables. The in folder contained file names in accordance with host names on the victim’s network, likely imported through a scanning tool. The out folder contained various files listed in Table 2 below. Rhysida actors deployed these tools and scripts to assist system and network-wide encryption.
Table 2: Malicious Executables Affiliated with Rhysida Infections
Executes conhost.exe on compromised victim systems, which encrypts and appends the extension of .Rhysida across the environment.
Rhysida ransomware uses a Windows 64-bit Portable Executable (PE) or common object file format (COFF) compiled using MinGW via the GNU Compiler Collection (GCC), which supports various programming languages such as C, C++, and Go. The cryptographic ransomware application first injects the PE into running processes on the compromised system [T1055.002]. Additionally, third-party researchers identified evidence of Rhysida actors developing custom tools with program names set to “Rhysida-0.1” [T1587].
Encryption
After mapping the network, the ransomware encrypts data using a 4096-bit RSA encryption key with a ChaCha20 algorithm [T1486]. The algorithm features a 256-bit key, a 32-bit counter, and a 96-bit nonce along with a four-by-four matrix of 32-bit words in plain text. Registry modification commands [T1112] are not obfuscated, displayed as plain-text strings and executed via cmd.exe.
Rhysida’s encryptor runs a file to encrypt and modify all encrypted files to display a .rhysida extension.[5] Following encryption, a PowerShell command deletes the binary [T1070.004] from the network using a hidden command window [T1564.003]. The Rhysida encryptor allows arguments -d (select a directory) and -sr (file deletion), defined by the authors of the code as parseOptions.[6] After the lines of binary strings complete their tasks, they delete themselves through the control panel to evade detection.
Data Extortion
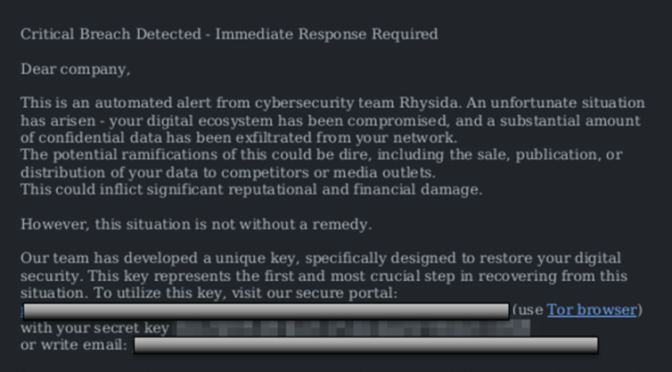
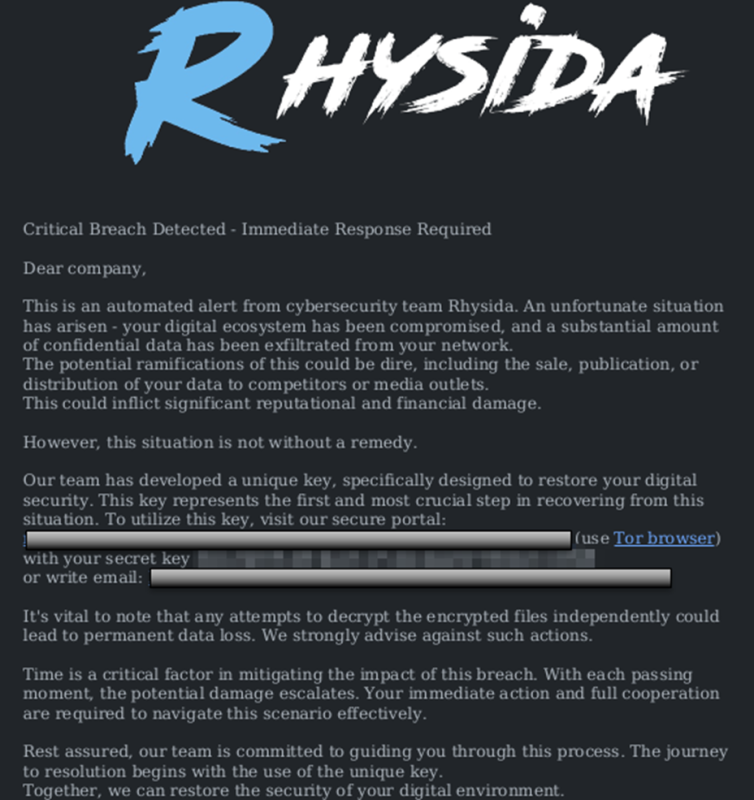
Rhysida actors reportedly engage in “double extortion” [T1657]—demanding a ransom payment to decrypt victim data and threatening to publish the sensitive exfiltrated data unless the ransom is paid.[5],[7] Rhysida actors direct victims to send ransom payments in Bitcoin to cryptocurrency wallet addresses provided by the threat actors. As shown in Figure 1, Rhysida ransomware drops a ransom note named “CriticalBreachDetected” as a PDF file—the note provides each company with a unique code and instructions to contact the group via a Tor-based portal.
Figure 1: Rhysida Ransom Note
Identified in analysis and also listed in open source reporting, the contents of the ransom note are embedded as plain-text in the ransom binary, offering network defenders an opportunity to deploy string-based detection for alerting on evidence of the ransom note. Rhysida threat actors may target systems that do not use command-line operating systems. The format of the PDF ransom notes could indicate that Rhysida actors only target systems that are compatible with handling PDF documents.[8]
INDICATORS OF COMPROMISE
On November 10, 2023, Sophos published TTPs and IOCs identified from analysis conducted for six separate incidents.[9] The C2 IP addresses listed in Table 3 were derived directly from Sophos’ investigations and are listed on GitHub among other indicators.[10]
Table 3: C2 IP Addresses Used for Rhysida Operations
C2 IP Address
5.39.222[.]67
5.255.99[.]59
51.77.102[.]106
108.62.118[.]136
108.62.141[.]161
146.70.104[.]249
156.96.62[.]58
157.154.194[.]6
Additional IOCs were obtained from FBI, CISA, and the MS-ISAC’s investigations and analysis. The email addresses listed in Table 4 are associated with Rhysida actors’ operations. Rhysida actors have been observed creating Onion Mail email accounts for services or victim communication, commonly in the format: [First Name][Last Name]@onionmail[.]org.
Table 4: Email Addresses Used to Support Rhysida Operations
Email Address
rhysidaeverywhere@onionmail[.]org
rhysidaofficial@onionmail[.]org
Rhysida actors have also been observed using the following files and executables listed in Table 5 to support their operations.
Disclaimer: Organizations are encouraged to investigate the use of these files for related signs of compromise prior to performing remediation actions.
This artifact is created when a user establishes a connection using psexec. It is removed after the connection is terminated, which is why there is no hash available for this executable.
MITRE ATT&CK TACTICS AND TECHNIQUES
See Tables 6-15 for all referenced threat actor tactics and techniques in this advisory. For assistance with mapping malicious cyber activity to the MITRE ATT&CK framework, see CISA and MITRE’s Best Practices for MITRE ATT&CK Mapping and CISA’s Decider Tool.
Additional notable TTPs have been published by the Check Point Incident Response Team.[11]
Rhysida actors have been observed developing resources and custom tools, particularly with program names set to “Rhysida-0.1” to gain access to victim systems.
Rhysida actors have been observed using secretsdump to extract credentials and other confidential information from a system, then dumping NTDS credentials.
Rhysida actors reportedly engage in “double extortion”— demanding a ransom payment to decrypt victim data and threatening to publish the sensitive exfiltrated data unless the ransom is paid.
MITIGATIONS
FBI, CISA, and the MS-ISAC recommend that organizations implement the mitigations below to improve your organization’s cybersecurity posture. These mitigations align with the Cross-Sector Cybersecurity Performance Goals (CPGs) developed by CISA and the National Institute of Standards and Technology (NIST). The CPGs provide a minimum set of practices and protections that CISA and NIST recommend all organizations implement. CISA and NIST based the CPGs on existing cybersecurity frameworks and guidance to protect against the most common and impactful threats, and TTPs. Visit CISA’s Cross-Sector Cybersecurity Performance Goals for more information on the CPGs, including additional recommended baseline protections.
These mitigations apply to all critical infrastructure organizations and network defenders. FBI, CISA, and the MS-ISAC recommend incorporating secure-by-design and -default principles, limiting the impact of ransomware techniques and strengthening overall security posture. For more information on secure by design, see CISA’s Secure by Design webpage.
Require phishing-resistant MFAfor all services to the extent possible, particularly for webmail, VPN, and accounts that access critical systems [CPG 2.H].
Disable command-line and scripting activities and permissions. Privilege escalation and lateral movement often depend on software utilities running from the command line. If threat actors are not able to run these tools, they will have difficulty escalating privileges and/or moving laterally [CPG 2.N].
Implement verbose and enhanced logging within processes such as command line auditing[12] and process tracking[13].
Restrict the use of PowerShell using Group Policy and only grant access to specific users on a case-by-case basis. Typically, only those users or administrators who manage the network or Windows operating systems should be permitted to use PowerShell [CPG 2.E].
Update Windows PowerShell or PowerShell Core to the latest version and uninstall all earlier PowerShell versions. Logs from Windows PowerShell prior to version 5.0 are either non-existent or do not record enough detail to aid in enterprise monitoring and incident response activities [CPG 1.E, 2.S, 2.T].
PowerShell logs contain valuable data, including historical operating system and registry interaction and possible TTPs of a threat actor’s PowerShell use.
Ensure PowerShell instances (using the latest version) have module, script block, and transcription logging enabled (e.g., enhanced logging).
The two logs that record PowerShell activity are the PowerShell Windows event log and the PowerShell operational log. FBI, CISA, and the MS-ISAC recommend turning on these two Windows event logs with a retention period of at least 180 days. These logs should be checked on a regular basis to confirm whether the log data has been deleted or logging has been turned off. Set the storage size permitted for both logs to as large as possible.
Restrict the use of RDP and other remote desktop services to known user accounts and groups. If RDP is necessary, apply best practices such as [CPG 2.W]:
Implement MFA for privileged accounts using RDP.
Use Remote Credential Guard[14] to protect credentials, particularly domain administrator or other high value accounts.
Audit the network for systems using RDP.
Close unused RDP ports.
Enforce account lockouts after a specified number of attempts.
Log RDP login attempts.
Secure remote access tools by:
Implementing application controls to manage and control execution of software, including allowlisting remote access programs. Application controls should prevent the installation and execution of portable versions of unauthorized remote access and other software. A properly configured application allowlisting solution will block any unlisted application execution. Allowlisting is important as antivirus solutions may fail to detect the execution of malicious portable executables when the files use any combination of compression, encryption, or obfuscation.
In addition, FBI, CISA, and the MS-ISAC recommend network defenders apply the following mitigations to limit potential adversarial use of common system and network discovery techniques, and to reduce the impact and risk of compromise by ransomware or data extortion actors:
Keep all operating systems, software, and firmware up to date. Timely patching is one of the most efficient and cost-effective steps an organization can take to minimize its exposure to cybersecurity threats. Prioritize patching known exploited vulnerabilities in internet-facing systems [CPG 1.E].
Segment networks to prevent the spread of ransomware. Network segmentation can help prevent the spread of ransomware by controlling traffic flows between—and access to—various subnetworks and by restricting adversary lateral movement [CPG 2.F].
Identify, detect, and investigate abnormal activity and potential traversal of the indicated ransomware with a network monitoring tool. To aid in detecting ransomware, implement a tool that logs and reports all network traffic, including lateral movement activity on a network. Endpoint detection and response (EDR) tools are particularly useful for detecting lateral connections as they have insight into common and uncommon network connections for each host [CPG 3.A].
Audit user accounts with administrative privileges and configure access controls according to the principle of least privilege (PoLP) [CPG 2.E].
Implement time-based access for accounts set at the admin level and higher [CPG 2.A, 2.E]. For example, the just-in-time (JIT) access method provisions privileged access when needed and can support the enforcement of PoLP (as well as the zero trust model). This is a process where a network-wide policy is set in place to automatically disable admin accounts at the AD level when the account is not in direct need. Individual users may submit their requests through an automated process that grants them access to a specified system for a set timeframe when they need to support the completion of a certain task.
Implement a recovery plan to maintain and retain multiple copies of sensitive or proprietary data and servers in a physically separate, segmented, and secure location (e.g., hard drive, storage device, or the cloud).
Maintain offline backups of data and regularly maintain backups and their restoration (daily or weekly at minimum). By instituting this practice, organizations limit the severity of disruption to business operations [CPG 2.R].
Ensure all backup data is encrypted, immutable (i.e., cannot be altered or deleted), and covers the entire organization’s data infrastructure [CPG 2.K, 2.L, 2.R].
Forward log files to a hardened centralized logging server, preferably on a segmented network[CPG 2.F]. Review logging retention rates, such as for VPNs and network-based logs.
Consider adding an email banner to emails received from outside your organization [CPG 2.M].
Disable hyperlinks in received emails.
VALIDATE SECURITY CONTROLS
In addition to applying mitigations, FBI, CISA, and the MS-ISAC recommend exercising, testing, and validating your organization’s security program against the threat behaviors mapped to the MITRE ATT&CK for Enterprise framework in this advisory. FBI, CISA, and the MS-ISAC recommend testing your existing security controls inventory to assess how they perform against the ATT&CK techniques described in this advisory.
To get started:
Select an ATT&CK technique described in this advisory (see Tables 6-15).
Align your security technologies against the technique.
Test your technologies against the technique.
Analyze your detection and prevention technologies’ performance.
Repeat the process for all security technologies to obtain a set of comprehensive performance data.
Tune your security program, including people, processes, and technologies, based on the data generated by this process.
FBI, CISA, and the MS-ISAC recommend continually testing your security program, at scale, in a production environment to ensure optimal performance against the MITRE ATT&CK techniques identified in this advisory.
FBI is seeking any information that can be shared, to include boundary logs showing communication to and from foreign IP addresses, a sample ransom note, communications with Rhysida actors, Bitcoin wallet information, decryptor files, and/or a benign sample of an encrypted file.
Additional details requested include: a targeted company point of contact, status and scope of infection, estimated loss, operational impact, transaction IDs, date of infection, date detected, initial attack vector, and host and network-based indicators.
FBI and CISA do not encourage paying ransom as payment does not guarantee victim files will be recovered. Furthermore, payment may also embolden adversaries to target additional organizations, encourage other threat actors to engage in the distribution of ransomware, and/or fund illicit activities. Regardless of whether you or your organization have decided to pay the ransom, FBI and CISA urge you to promptly report ransomware incidents to the FBI’s Internet Crime Complaint Center (IC3) at Ic3.gov, a local FBI Field Office, or CISA via the agency’s Incident Reporting System or its 24/7 Operations Center at report@cisa.gov or (888) 282-0870.
The information in this report is being provided “as is” for informational purposes only. FBI, CISA, and the MS-ISAC do not endorse any commercial entity, product, company, or service, including any entities, products, or services linked within this document. Any reference to specific commercial entities, products, processes, or services by service mark, trademark, manufacturer, or otherwise, does not constitute or imply endorsement, recommendation, or favoring by FBI, CISA, and the MS-ISAC.
VERSION HISTORY
November 15, 2023: Initial version.
Iron Castle Systems
Manage Cookie Consent
To provide the best experiences, we use technologies like cookies to store and/or access device information. Consenting to these technologies will allow us to process data such as browsing behavior or unique IDs on this site. Not consenting or withdrawing consent, may adversely affect certain features and functions.
Functional
Always active
The technical storage or access is strictly necessary for the legitimate purpose of enabling the use of a specific service explicitly requested by the subscriber or user, or for the sole purpose of carrying out the transmission of a communication over an electronic communications network.
Preferences
The technical storage or access is necessary for the legitimate purpose of storing preferences that are not requested by the subscriber or user.
Statistics
The technical storage or access that is used exclusively for statistical purposes.The technical storage or access that is used exclusively for anonymous statistical purposes. Without a subpoena, voluntary compliance on the part of your Internet Service Provider, or additional records from a third party, information stored or retrieved for this purpose alone cannot usually be used to identify you.
Marketing
The technical storage or access is required to create user profiles to send advertising, or to track the user on a website or across several websites for similar marketing purposes.