One of the challenges with distributed systems is that they are made up of many interdependent services, which add a degree of complexity when you are trying to monitor their performance. Determining which services and APIs are experiencing high latencies or degraded availability requires manually putting together telemetry signals. This can result in time and effort establishing the root cause of any issues with the system due to the inconsistent experiences across metrics, traces, logs, real user monitoring, and synthetic monitoring.
You want to provide your customers with continuously available and high-performing applications. At the same time, the monitoring that assures this must be efficient, cost-effective, and without undifferentiated heavy lifting.
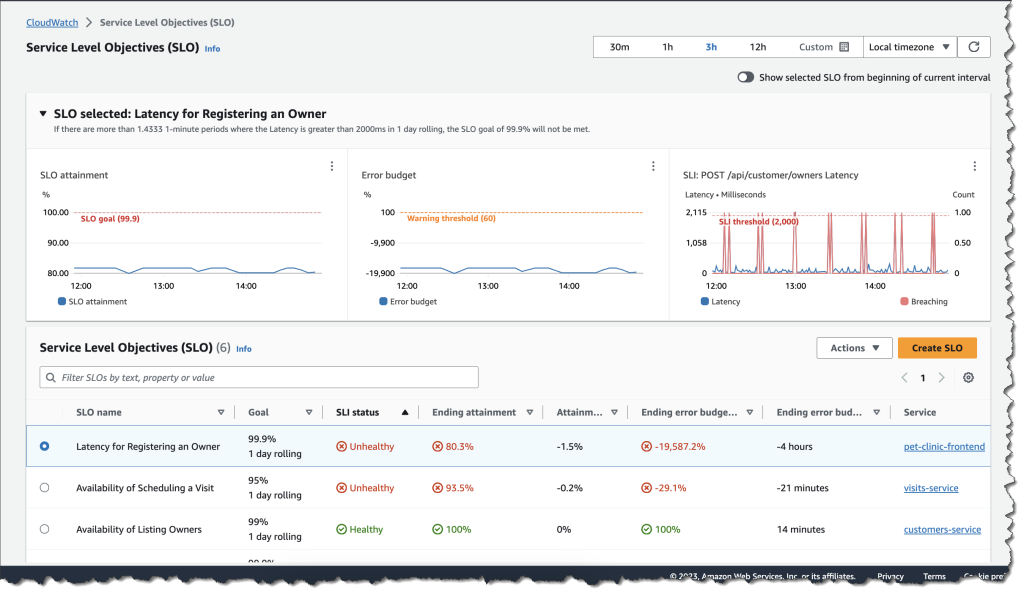
Amazon CloudWatch Application Signals helps you automatically instrument applications based on best practices for application performance. There is no manual effort, no custom code, and no custom dashboards. You get a pre-built, standardized dashboard showing the most important metrics, such as volume of requests, availability, latency, and more, for the performance of your applications. In addition, you can define Service Level Objectives (SLOs) on your applications to monitor specific operations that matter most to your business. An example of an SLO could be to set a goal that a webpage should render within 2000 ms 99.9 percent of the time in a rolling 28-day interval.
Application Signals automatically correlates telemetry across metrics, traces, logs, real user monitoring, and synthetic monitoring to speed up troubleshooting and reduce application disruption. By providing an integrated experience for analyzing performance in the context of your applications, Application Signals gives you improved productivity with a focus on the applications that support your most critical business functions.
My personal favorite is the collaboration between teams that’s made possible by Application Signals. I started this post by mentioning that distributed systems are made up of many interdependent services. On the Service Map, which we will look at later in this post, if you, as a service owner, identify an issue that’s caused by another service, you can send a link to the owner of the other service to efficiently collaborate on the triage tasks.
Getting started with Application Signals
You can easily collect application and container telemetry when creating new Amazon EKS clusters in the Amazon EKS console by enabling the new Amazon CloudWatch Observability EKS add-on. Another option is to enable for existing Amazon EKS Clusters or other compute types directly in the Amazon CloudWatch console.
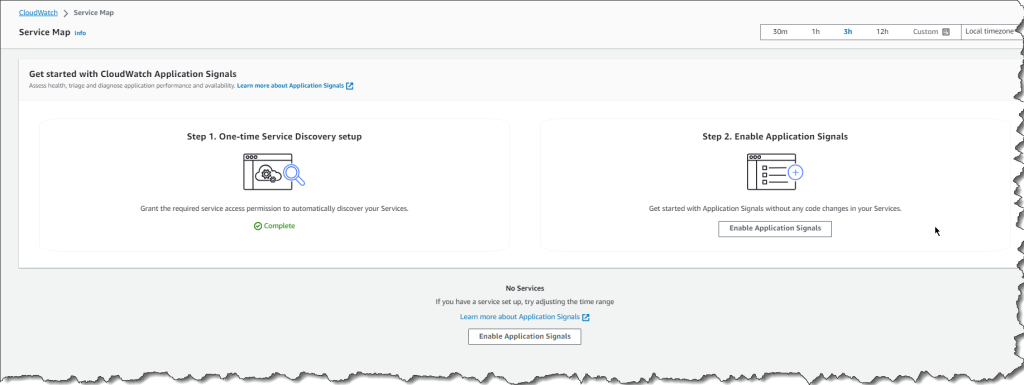
After enabling Application Signals via the Amazon EKS add-on or Custom option for other compute types, Application Signals automatically discovers services and generates a standard set of application metrics such as volume of requests and latency spikes or availability drops for APIs and dependencies, to name a few.
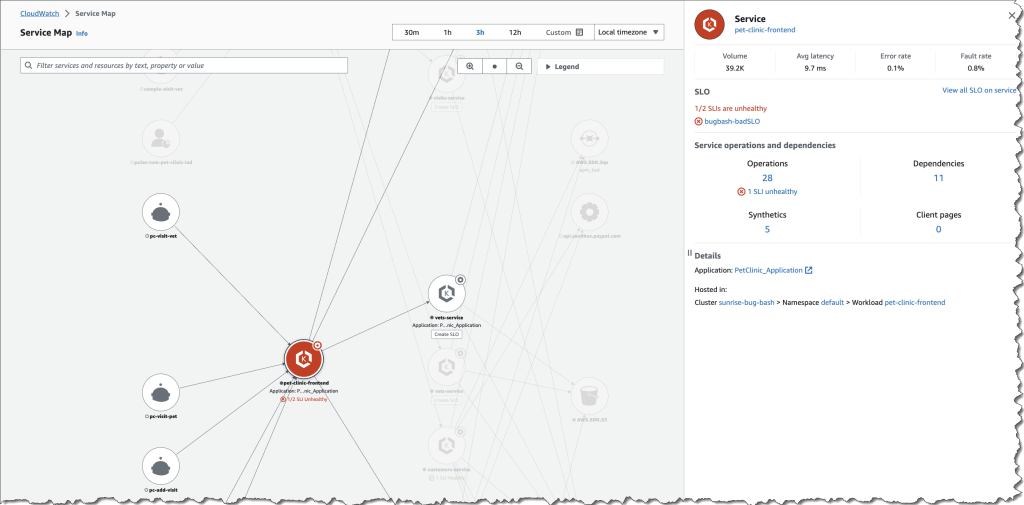
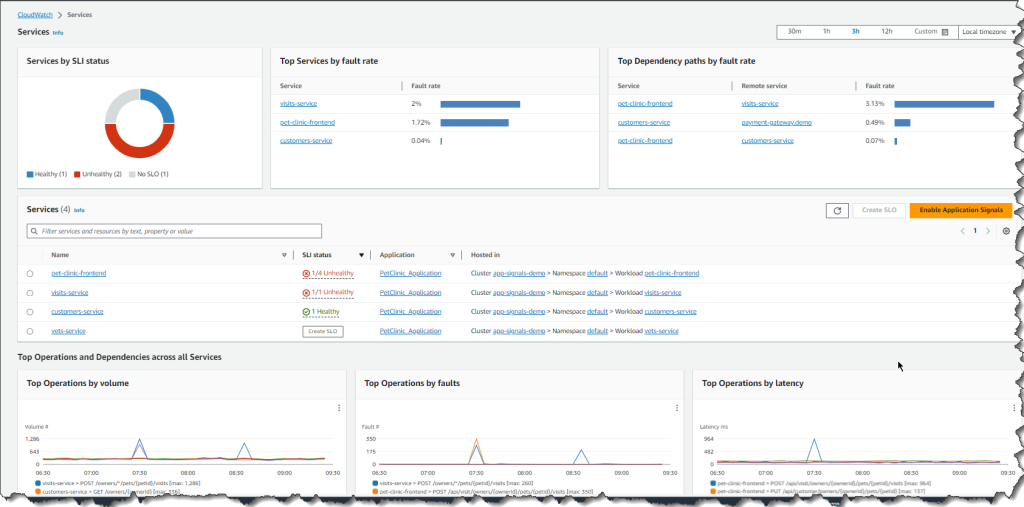
All of the services discovered and their golden metrics (volume of requests, latency, faults and errors) are then automatically displayed on the Services page and the Service Map. The Service Map gives you a visual deep dive to evaluate the health of a service, its operations, dependencies, and all the call paths between an operation and a dependency.
The list of services that are enabled in Application Signals will also show in the services dashboard, along with operational metrics across all of your services and dependencies to easily spot anomalies. The Application column is auto-populated if the EKS cluster belongs to an application that’s tagged in AppRegistry. The Hosted In column automatically detects which EKS pod, cluster, or namespace combination the service requests are running in, and you can select one to go directly to Container Insights for detailed container metrics such as CPU or memory utilization, to name a few.
Team collaboration with Application Signals
Now, to expand on the team collaboration that I mentioned at the beginning of this post. Let’s say you consult the services dashboard to do sanity checks and you notice two SLO issues for one of your services named pet-clinic-frontend. Your company maintains a set of SLOs, and this is the view that you use to understand how the applications are performing against the objectives. For the services that are tagged in AppRegistry all teams have a central view of the definition and ownership of the application. Further navigation to the service map gives you even more details on the health of this service.
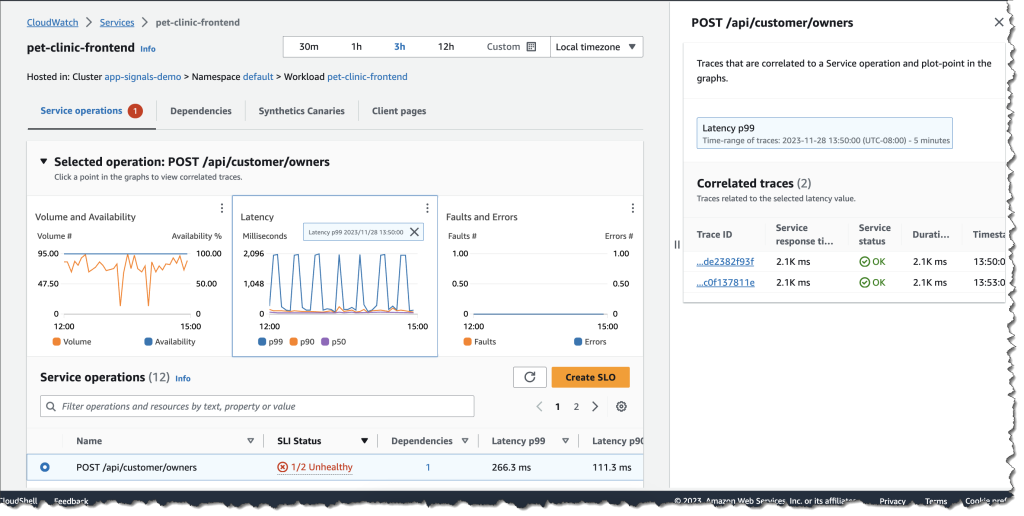
At this point you make the decision to send the link to thepet-clinic-frontendservice to Sarah whose details you found in the AppRegistry. Sarah is the person on-call for this service. The link allows you to efficiently collaborate with Sarah because it’s been curated to land directly on the triage view that is contextualized based on your discovery of the issue. Sarah notices that the POST /api/customer/owners latency has increased to 2k ms for a number of requests and as the service owner, dives deep to arrive at the root cause.
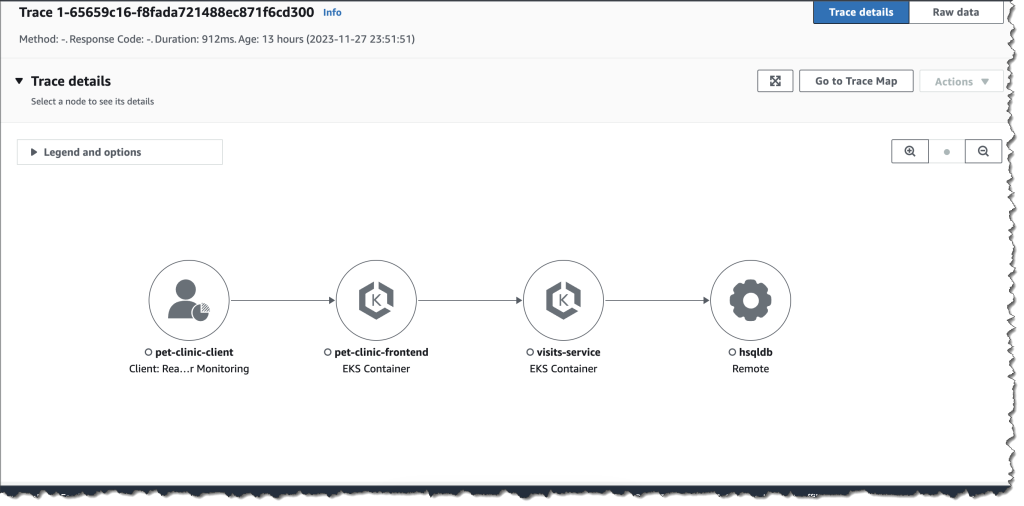
Clicking into the latency graph returns a correlated list of traces that correspond directly to the operation, metric, and moment in time, which helps Sarah to find the exact traces that may have led to the increase in latency.
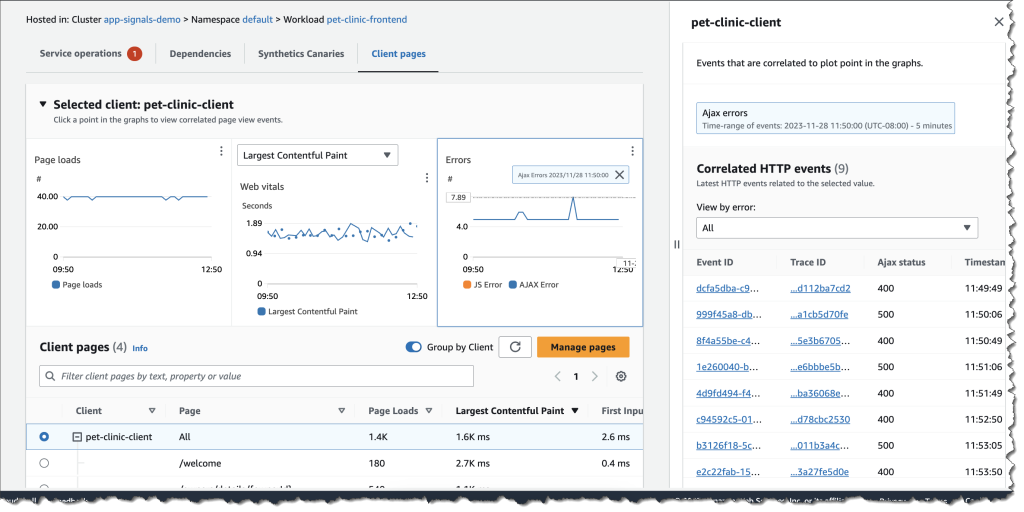
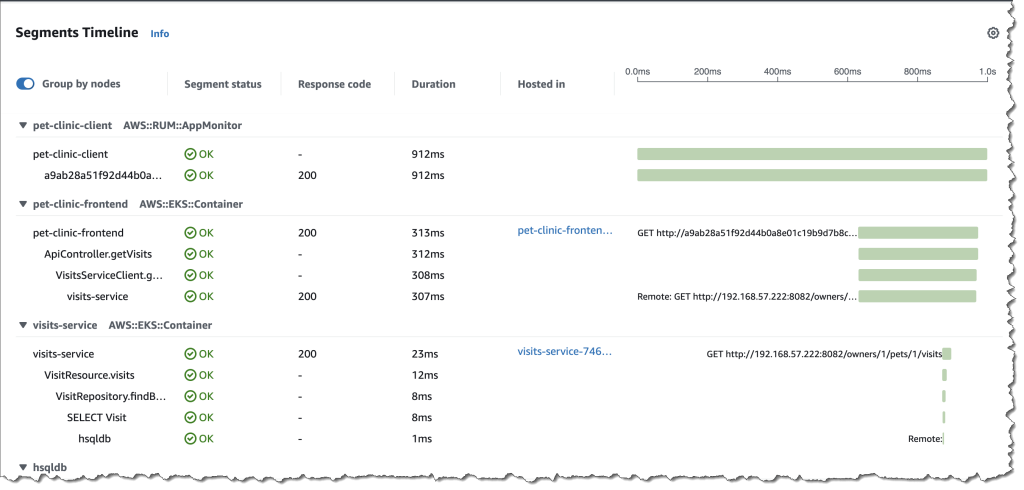 Sarah uses Amazon CloudWatch Synthetics and Amazon CloudWatch RUM and has enabled the X-Ray active tracing integration to automatically see the list of relevant canaries and pages correlated to the service. This integrated view now helps Sarah gain multiple perspectives in the performance of the application and quickly troubleshoot anomalies in a single view.
Available now
Amazon CloudWatch Application Signals is available in preview and you can start using it today in the following AWS Regions: US East (N. Virginia), US East (Ohio), US West (Oregon), Europe (Ireland), Asia Pacific (Sydney), and Asia Pacific (Tokyo).
To learn more, visit the Amazon CloudWatch user guide and the One Observability Workshop. You can submit your questions to AWS re:Post for Amazon CloudWatch, or through your usual AWS Support contacts.
– Veliswa

