This
post was originally published on
this siteUnstructured text to interactive knowledge graph via LLM & SPO triplet extraction
Courtesy of TLDR InfoSec Launches & Tools again, another fine discovery in Robert McDermott’s AI Powered Knowledge Graph Generator. Robert’s system takes unstructured text, uses your preferred LLM and extracts knowledge in the form of Subject-Predicate-Object (SPO) triplets, then visualizes the relationships as an interactive knowledge graph.[1]
Robert has documented AI Powered Knowledge Graph Generator (AIKG) beautifully, I’ll not be regurgitating it needlessly, so please read further for details regarding features, requirements, configuration, and options. I will detail a few installation insights that got me up and running quickly.
The feature summary is this:
AIKG automatically splits large documents into manageable chunks for processing and uses AI to identify entities and their relationships. As AIKG ensures consistent entity naming across document chunks, it discovers additional relationships between disconnected parts of the graph, then creates an interactive graph visualization. AIKG works with any OpenAI-compatible API endpoint; I used Ollama exclusively here with Google’s Gemma 3, a lightweight family of models built on Gemini technology. Gemma 3 is multimodal, processing text and images, and is the current, most capable model that runs on a single GPU. I ran my experimemts on a Lenovo ThinkBook 14 G4 circa 2022 with an AMD Ryzen 7 5825U 8-core processor, Radeon Graphics, and 40gb memory running Ubuntu 24.04.3 LTS.
My installation guidelines assume you have a full instance of Python3 and Ollama installed. My installation was implemented under my tools directory.
python3 -m venv aikg # Establish a virtual environment for AIKG
cd aikg
git clone https://github.com/robert-mcdermott/ai-knowledge-graph.git # Clone AIKG into virtual environment
bin/pip3 install -r ai-knowledge-graph/requirements.txt # Install AIKG requirements
bin/python3 ai-knowledge-graph/generate-graph.py --help # Confirm AIKG installation is functional
ollama pull gemma3 # Pull the Gemma 3 model from Ollama
I opted to test AIKG via a couple of articles specific to Russian state-sponsored adversarial cyber campaigns as input:
My use of these articles in particular was based on the assertion that APT and nation state activity is often well represented via interactive knowledge graph. I’ve advocated endlessly for visual link analysis and graph tech, including Maltego (the OG of knowledge graph tools) at far back as 2009, Graphviz in 2015, GraphFrames in 2018 and Beagle in 2019. As always, visualization, coupled with entity relationship mappings, are an imperative for security analysts, threat hunters, and any security professional seeking deeper and more meaningful insights. While the SecurityWeek piece is a bit light on content and density, it served well as a good initial experiment.
The CISA advisory is much more dense and served as an excellent, more extensive experiment.
I pulled them both into individual text files more easily ingested for processing with AIKG, shared for you here if you’d like to play along at home.
Starting with SecurityWeek’s Russia’s APT28 Targeting Energy Research, Defense Collaboration Entities, and the subsequent Russia-APT28-targeting.txt file I created for model ingestion, I ran Gemma 3 as a 12 billion parameter model as follows:
ollama run gemma3:12b # Run Gemma 3 locally as 12 billion parameter model
~/tools/aikg/bin/python3 ~/tools/aikg/ai-knowledge-graph/generate-graph.py --config ~/tools/aikg/ai-knowledge-graph/config.toml -input data/Russia-APT28-targeting.txt --output Russia-APT28-targeting-kg-12b.html
You may want or need to run Gemma 3 with fewer parameters depending on the performance and capabilities of your local system. Note that I am calling file paths rather explicitly to overcome complaints about missing config and input files.
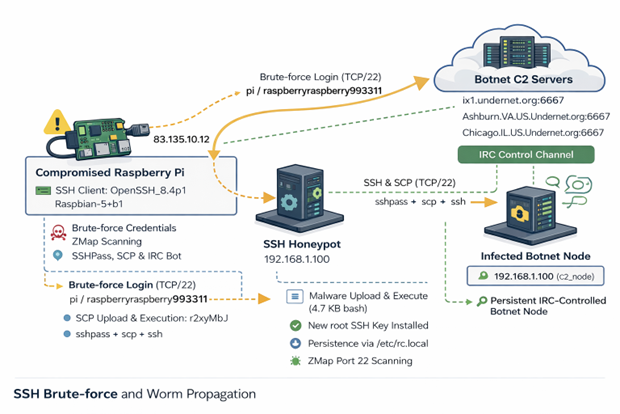
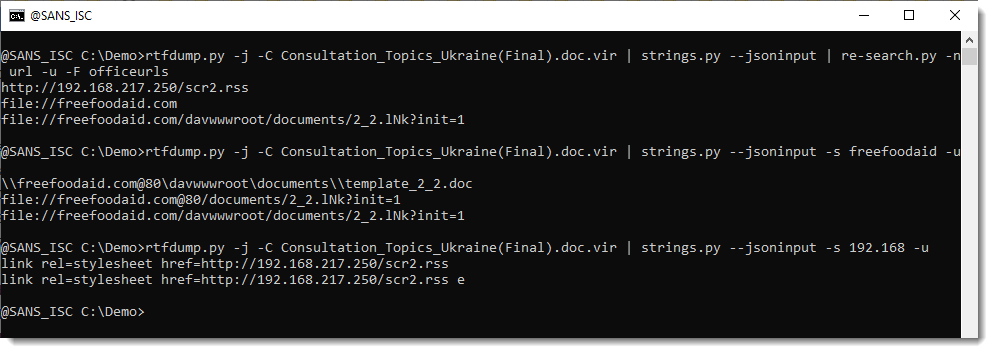
The article makes reference to APT credential harvesting activity targeting people associated with a Turkish energy and nuclear research agency, as well as a spoofed OWA login portal containing Turkish-language text to target Turkish scientists and researchers. As part of it’s use of semantic triples (Subject-Predicate-Object (SPO) triplets), how does AIKG perform linking entities, attributes and values into machine readable statements [2] derived from the article content, as seen in Figure 1?
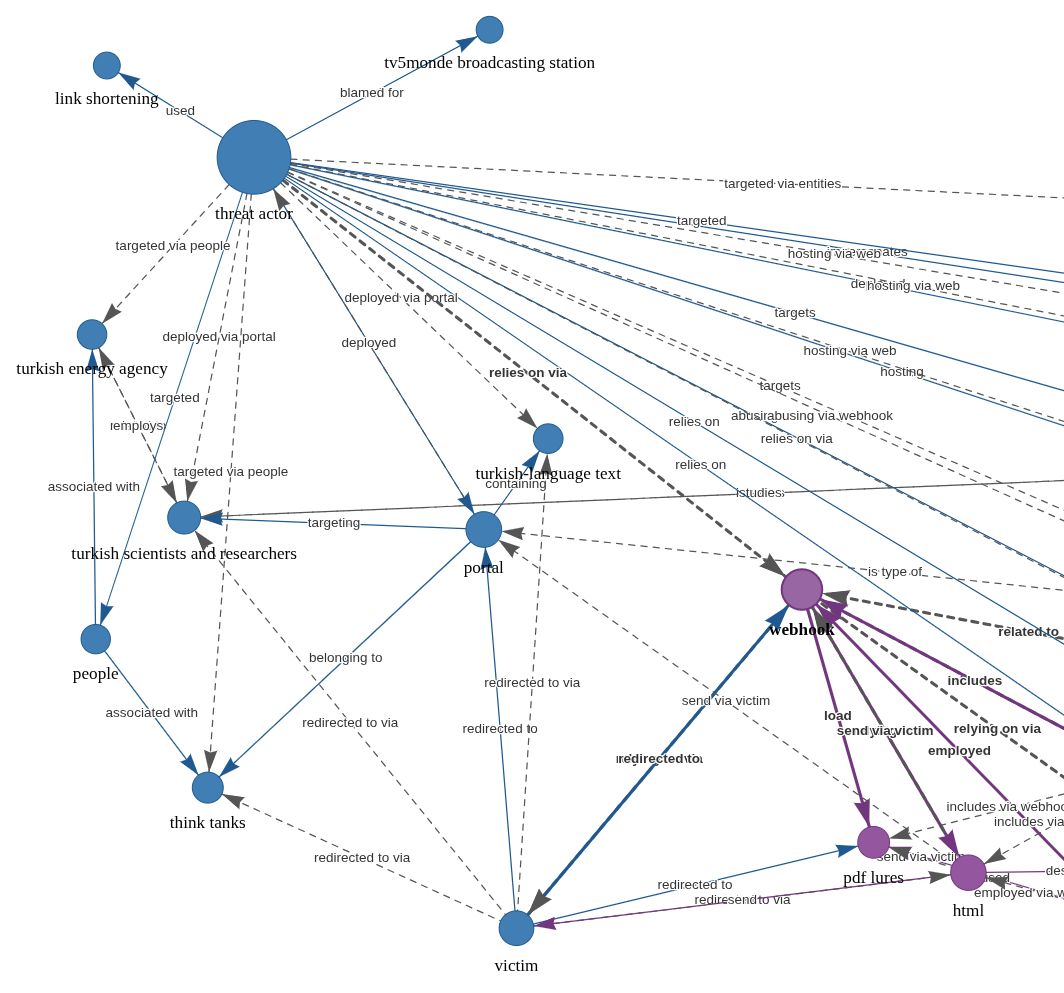
Figure 1: AIKG Gemma 3:12b result from SecurityWeek article
Quite well, I’d say. To manipulate the graph, you may opt to disable physics in the graph output toolbar so you can tweak node placements. As drawn from the statistics view for this graph, AIKG generated 38 nodes, 105 edges, 52 extracted edges, 53 inferred edges, and four communities. You can further filter as you see fit, but even unfiltered, and with just a little by of tuning at the presentation layer, we can immediately see success where semantic triples immediately emerge to excellent effect. We can see entity/relationship connections where, as an example, threat actor –> targeted –> people and people –> associated with –> think tanks, with direct reference to the aforementioned OWA portal and Turkish language. If you’re a cyberthreat intelligence analyst (CTI) or investigator, drawing visual conclusions derived from text processing will really help you step up your game in the form of context and enrichment in report writing. This same graph extends itself to represent the connection between the victims and the exploitation methods and infrastructure. If you don’t want to go through a full installation process for yourself to complete your own model execution, you should still grab the JSON and HTML output files and experiment with them in your browser. You’ll get a real sense of the power and impact of an interactive knowledge graph with the joint forces power of LLM and SPO triplets.
For a second experiment I selected related content in a longer, more in depth analysis courtesy of a CISA Cybersecurity Advisory (CISA friends, I’m pulling for you in tough times). If you are following along at home, be sure to exit ollama so you can rerun it with additional parameters (27b vs 12b); pass /bye as a message, and restart:
ollama run gemma3:27b # Run Gemma 3 locally with 27 billion parameters
~/tools/aikg/bin/python3 ~/tools/aikg/ai-knowledge-graph/generate-graph.py --config ~/tools/aikg/ai-knowledge-graph/config.toml --input ~/tools/aikg/ai-knowledge-graph/data/Russian-GRU-Targeting-Logistics-Tech.txt --output Russian-GRU-Targeting-Logistics-Tech-kg-27b.html
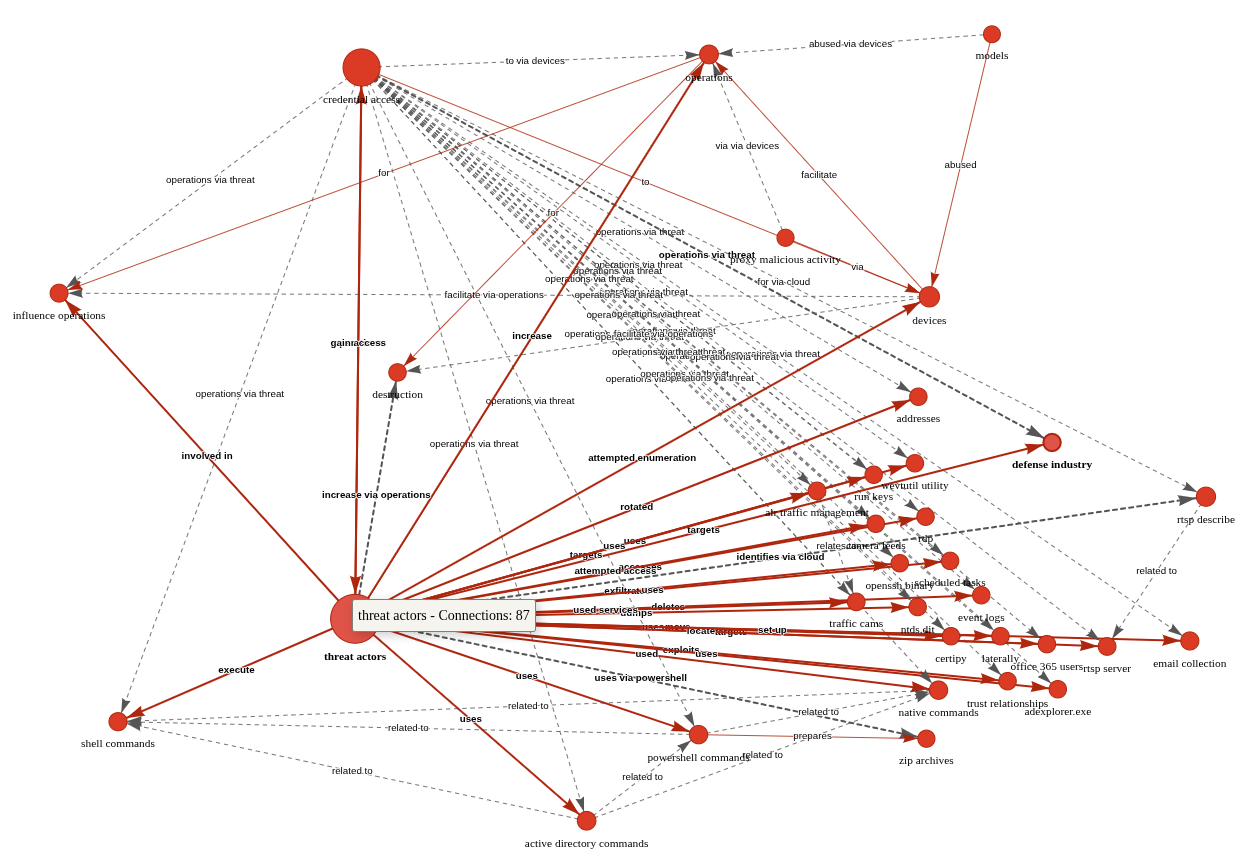
Given the density and length of this article, the graph as initially rendered is a bit untenable (no fault of AIKG) and requires some tuning and filtering for optimal effect. Graph Statistics for this experiment included 118 nodes, 486 edges, 152 extracted edges, 334 inferred edges, and seven communities. To filter, with a focus again on actions taken by Russian APT operatives, I chose as follows:
- Select a Node by ID: threat actors
- Select a network item: Nodes
- Select a property: color
- Select value(s): #e41a1c (red)
The result is more visually feasible, and allows ready tweaking to optimize network connections, as seen in Figure 2.
 ???????
Figure 2: AIKG Gemma 3:27b result from CISA advisory
Shocking absolutely no one, we immediately encapsulate actor activity specific to credential access and influence operations via shell commands, Active Directory commands, and PowerShell commands. The conclusive connection is drawn however as threat actors –> targets –> defense industry. Ya think? 😉 In the advisory, see Description of Targets, including defense industry, as well as Initial Access TTPs, including credential guessing and brute force, and finally Post-Compromise TTPs and Exfiltration regarding various shell and AD commands. As a security professional reading this treatise, its reasonable to assume you’ve read a CISA Cybersecurity Advisory before. As such, its also reasonable to assume you’ll agree that knowledge graph generation from a highly dense, content rich collection of IOCs and behaviors is highly useful. I intend to work with my workplace ML team to further incorporate the principles explored herein as part of our context and enrichment generation practices. I suggest you consider the same if you have the opportunity. While SPO triplets, aka semantic triples, are most often associated with search engine optimization (SEO), their use, coupled with LLM power, really shines for threat intelligence applications.
Cheers…until next time.
Russ McRee | @holisticinfosec | infosec.exchange/@holisticinfosec | LinkedIn.com/in/russmcree
Recommended reading and tooling:
References
[1] McDermott, R. (2025) AI Knowledge Graph. Available at: https://github.com/robert-mcdermott/ai-knowledge-graph (Accessed: 18 January 2026 – 11 February 2026).
[2] Reduan, M.H., (2025) Semantic Triples: Definition, Function, Components, Applications, Benefits, Drawbacks and Best Practices for SEO. Available at: https://www.linkedin.com/pulse/semantic-triples-definition-function-components-benefits-reduan-nqmec/ (Accessed: 11 February 2026).
(c) SANS Internet Storm Center. https://isc.sans.edu Creative Commons Attribution-Noncommercial 3.0 United States License.