Category Archives: AWS

IDE extension for AWS Application Composer enhances visual modern applications development with AI-generated IaC

This post was originally published on this site

Today, I’m happy to share the integrated development environment (IDE) extension for AWS Application Composer. Now you can use AWS Application Composer directly in your IDE to visually build modern applications and iteratively develop your infrastructure as code templates with Amazon CodeWhisperer.
Announced as preview at AWS re:Invent 2022 and generally available in March 2023, Application Composer is a visual builder that makes it easier for developers to visualize, design, and iterate on an application architecture by dragging, grouping, and connecting AWS services on a visual canvas. Application Composer simplifies building modern applications by providing an easy-to-use visual drag-and-drop interface and generates IaC templates in real time.

AWS Application Composer also lets you work with AWS CloudFormation resources. In September, AWS Application Composer announced support for 1000+ AWS CloudFormation resources. This provides you the flexibility to define configuration for your AWS resources at a granular level.

Building modern applications with modern tools
The IDE extension for AWS Application Composer provides you with the same visual drag-and-drop experience and functionality as what it offers you in the console. Utilizing the visual canvas in your IDE means you can quickly prototype your ideas and focus on your application code.
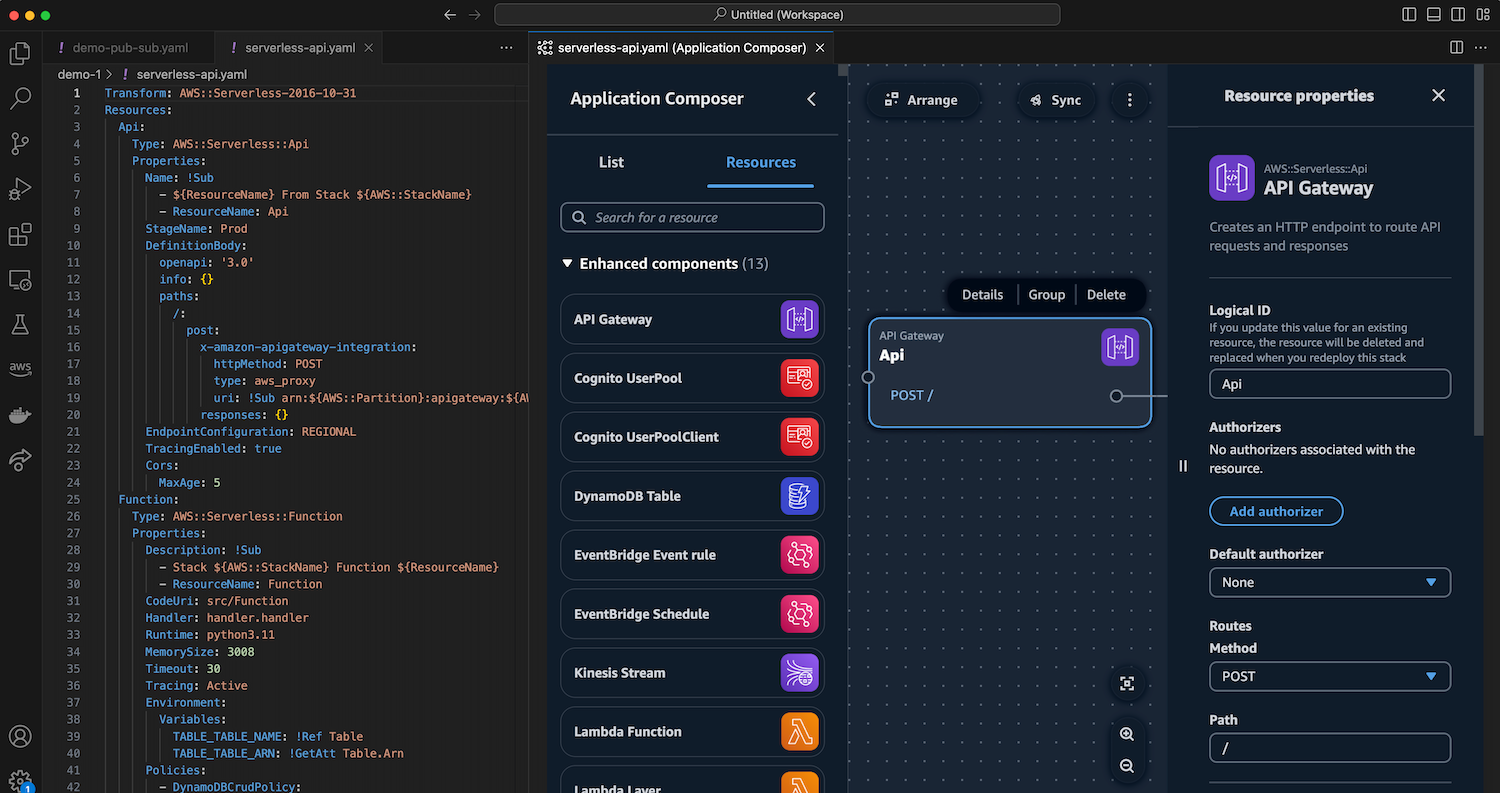
With Application Composer running in your IDE, you can also use the various tools available in your IDE. For example, you can seamlessly integrate IaC templates generated real-time by Application Composer with AWS Serverless Application Model (AWS SAM) to manage and deploy your serverless applications.

In addition to making Application Composer available in your IDE, you can create generative AI powered code suggestions in the CloudFormation template in real time while visualizing the application architecture in split view. You can pair and synchronize Application Composer’s visualization and CloudFormation template editing side by side in the IDE without context switching between consoles to iterate on their designs. This minimizes hand coding and increase your productivity.

Using AWS Application Composer in Visual Studio Code
First, I need to install the latest AWS Toolkit for Visual Studio Code plugin. If you already have the AWS Toolkit plugin installed, you only need to update the plugin to start using Application Composer.

To start using Application Composer, I don’t need to authenticate into my AWS account. With Application Composer available on my IDE, I can open my existing AWS CloudFormation or AWS SAM templates.
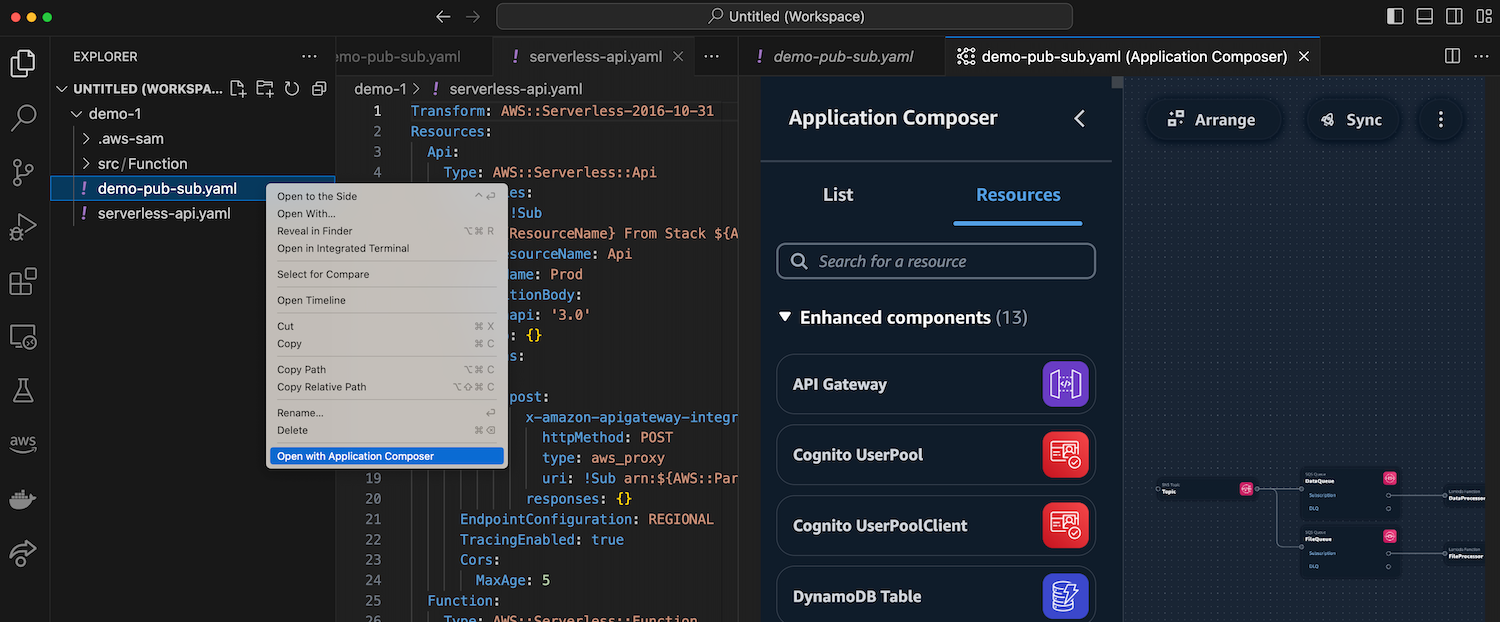
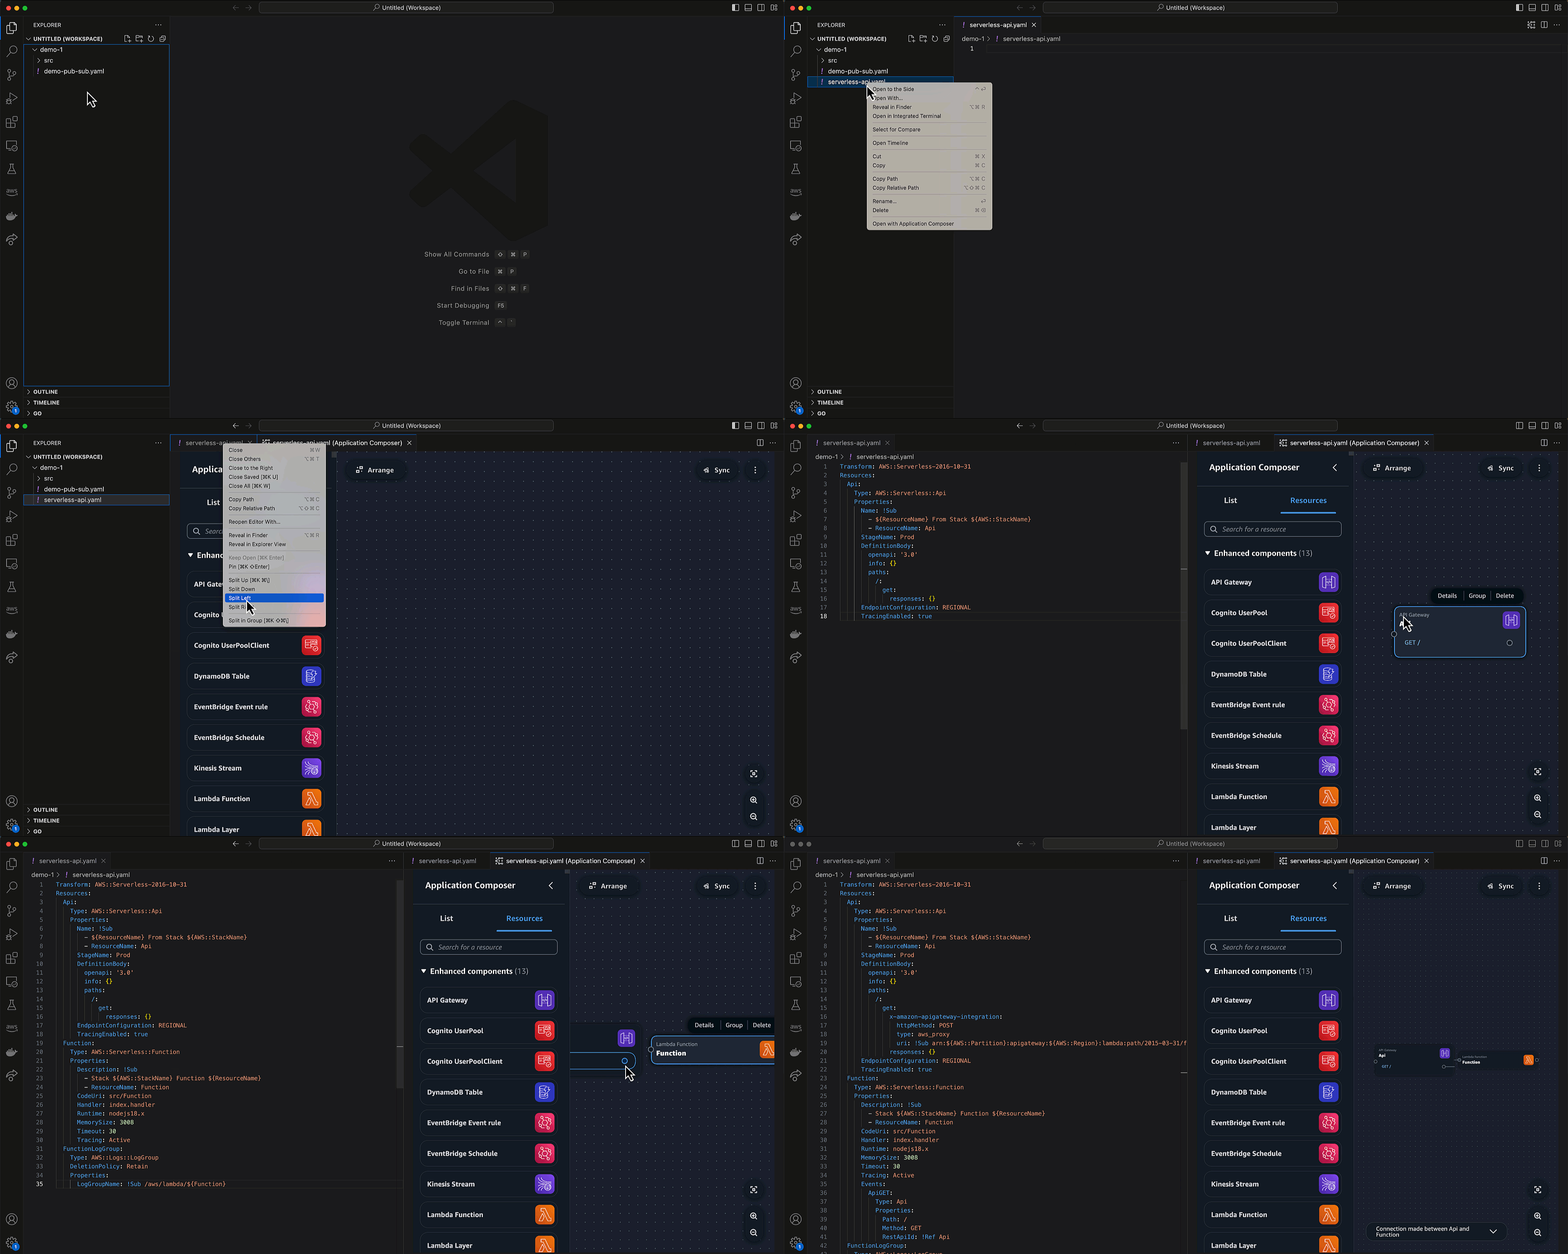
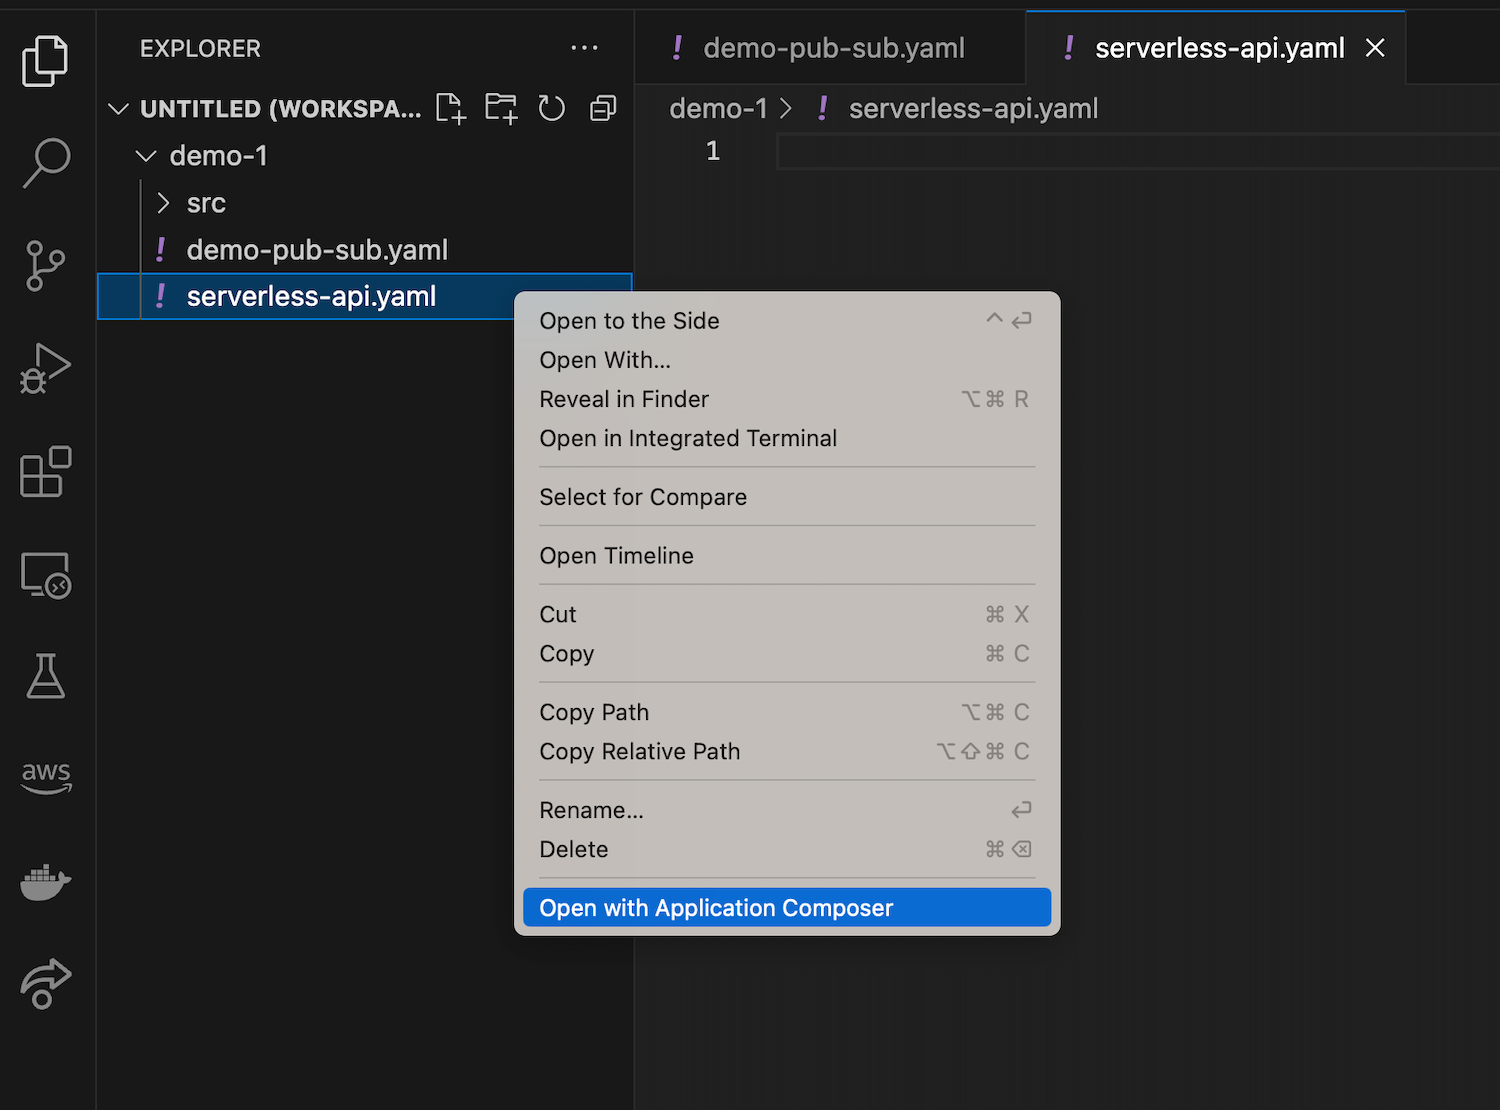
Another method is to create a new blank file, then right-click on the file and select Open with Application Composer to start designing my application visually.
This will provide me with a blank canvas. Here I have both code and visual editors at the same time to build a simple serverless API using Amazon API Gateway, AWS Lambda, and Amazon DynamoDB. Any changes that I make on the canvas will also be reflected in real time on my IaC template.
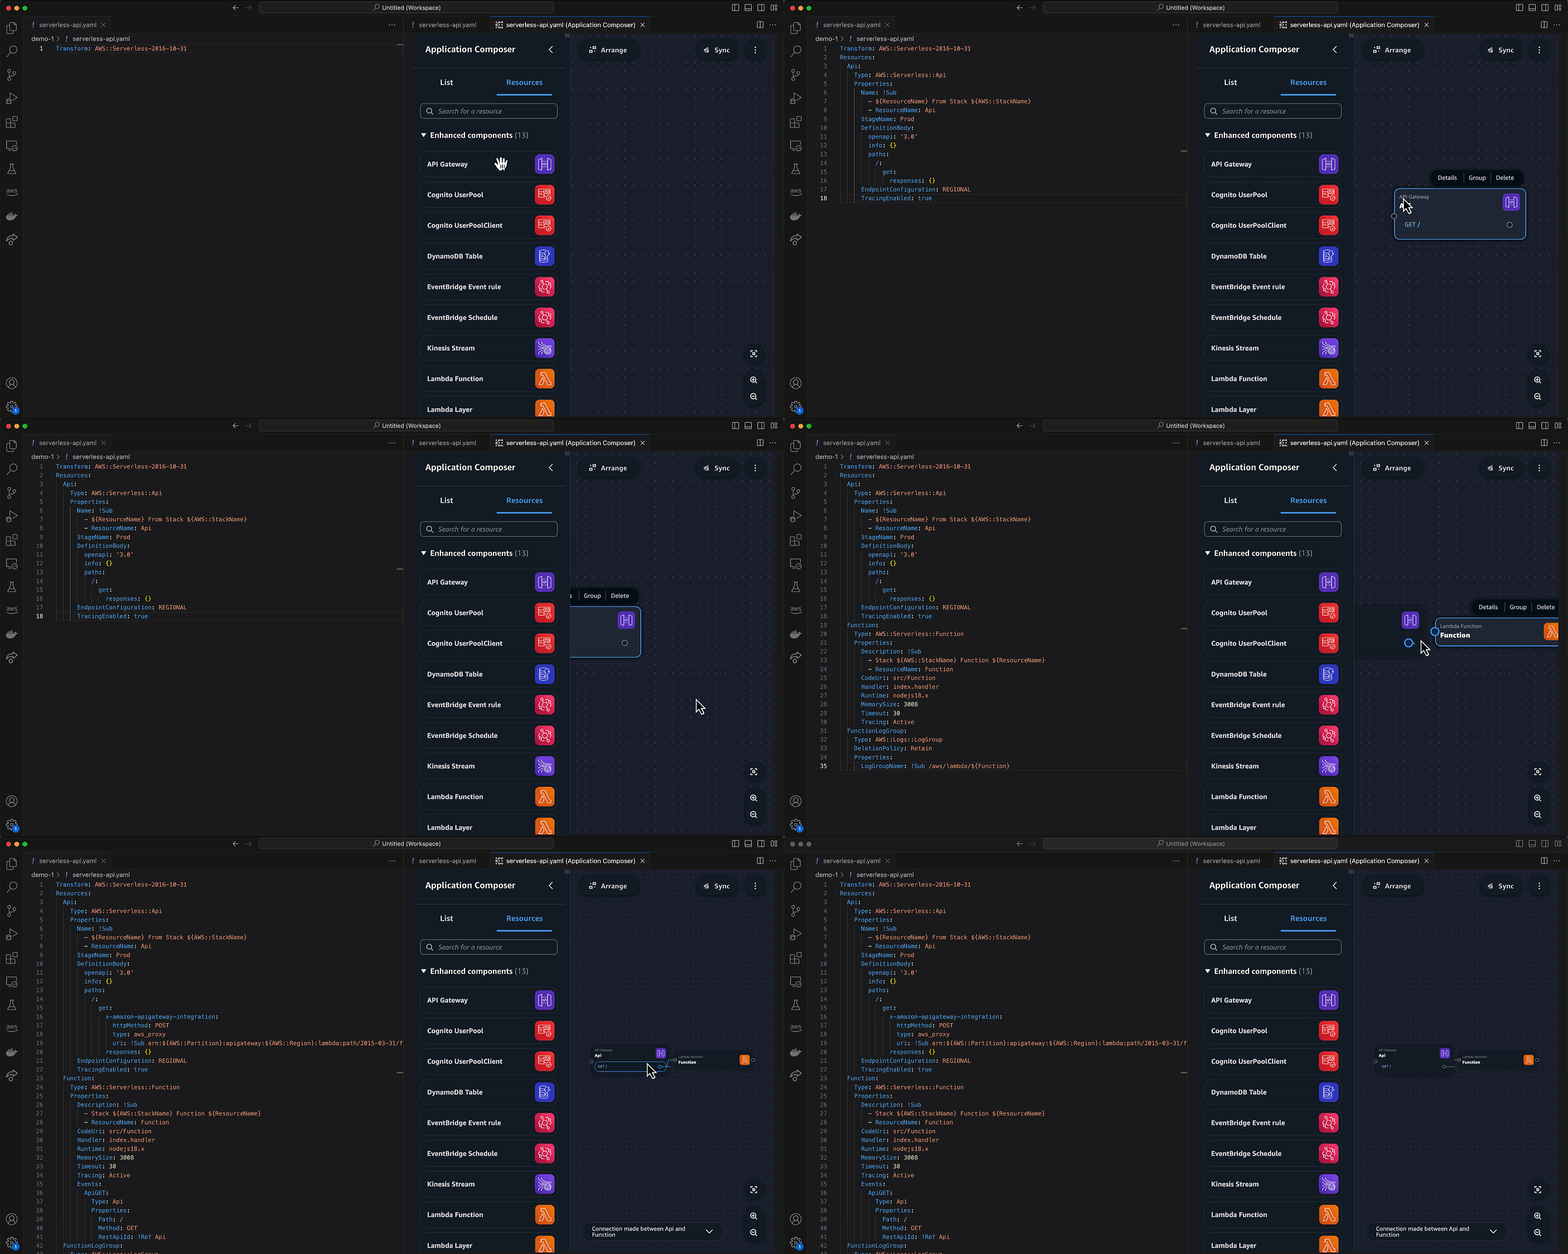
I get consistent experiences, such as when I use the Application Composer console. For example, if I make some modifications to my AWS Lambda function, it will also create relevant files in my local folder.

With IaC templates available in my local folder, it’s easier for me to manage my applications with AWS SAM CLI. I can create continuous integration and continuous delivery (CI/CD) with sam pipeline or deploy my stack with sam deploy.
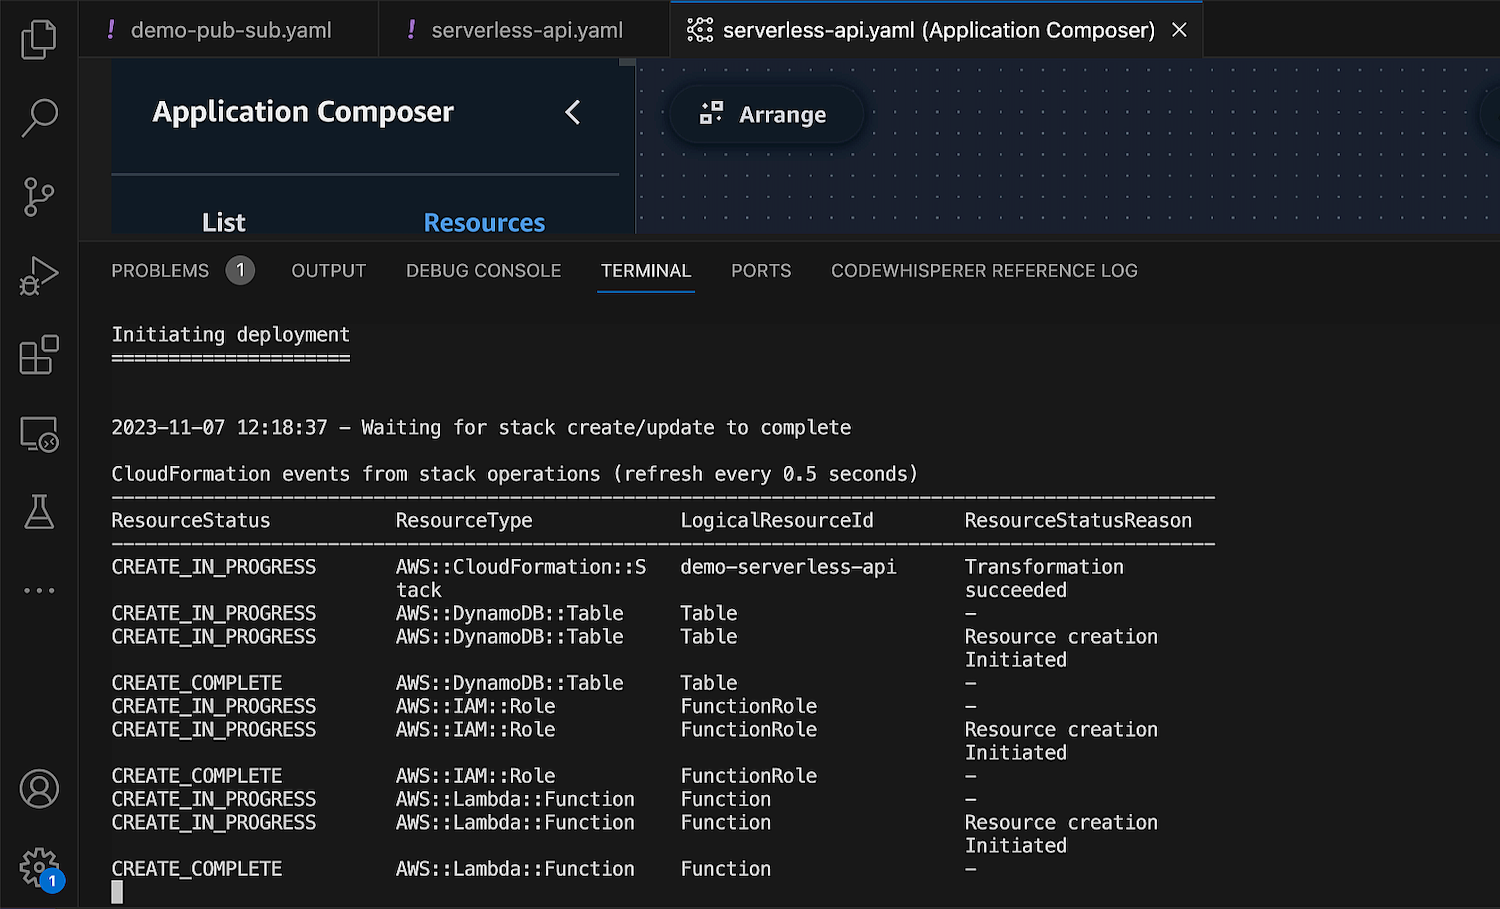
One of the features that accelerates my development workflow is the built-in Sync feature that seamlessly integrates with AWS SAM command sam sync. This feature syncs my local application changes to my AWS account, which is helpful for me to do testing and validation before I deploy my applications into a production environment.

Developing IaC templates with generative AI
With this new capability, I can use generative AI code suggestions to quickly get started with any of CloudFormation’s 1000+ resources. This also means that it’s now even easier to include standard IaC resources to extend my architecture.

For example, I need to use Amazon MQ, which is a standard IaC resource, and I need to modify some configurations for its AWS CloudFormation resource using Application Composer. In the Resource configuration section, change some values if needed, then choose Generate. Application Composer provides code suggestions that I can accept and incorporate into my IaC template.

This capability helps me to improve my development velocity by eliminating context switching. I can design my modern applications using AWS Application Composer canvas and use various tools such as Amazon CodeWhisperer and AWS SAM to accelerate my development workflow.

Things to know
Here are a couple of things to note:

Supported IDE – At launch, this new capability is available for Visual Studio Code.

Pricing – The IDE extension for AWS Application Composer is available at no charge.

Get started with IDE extension for AWS Application Composer by installing the latest AWS Toolkit for Visual Studio Code.

Happy coding!
Donnie

Amazon SageMaker Studio adds web-based interface, Code Editor, flexible workspaces, and streamlines user onboarding
This post was originally published on this site

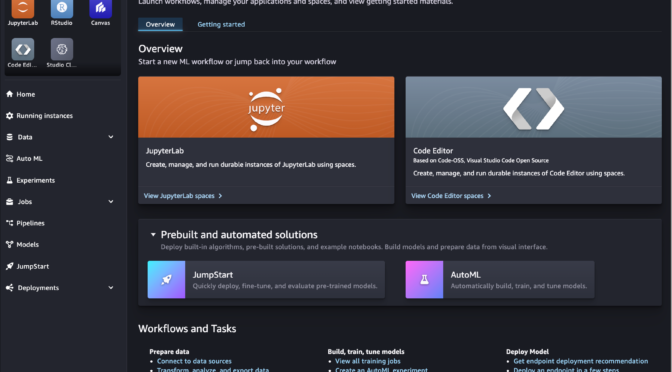
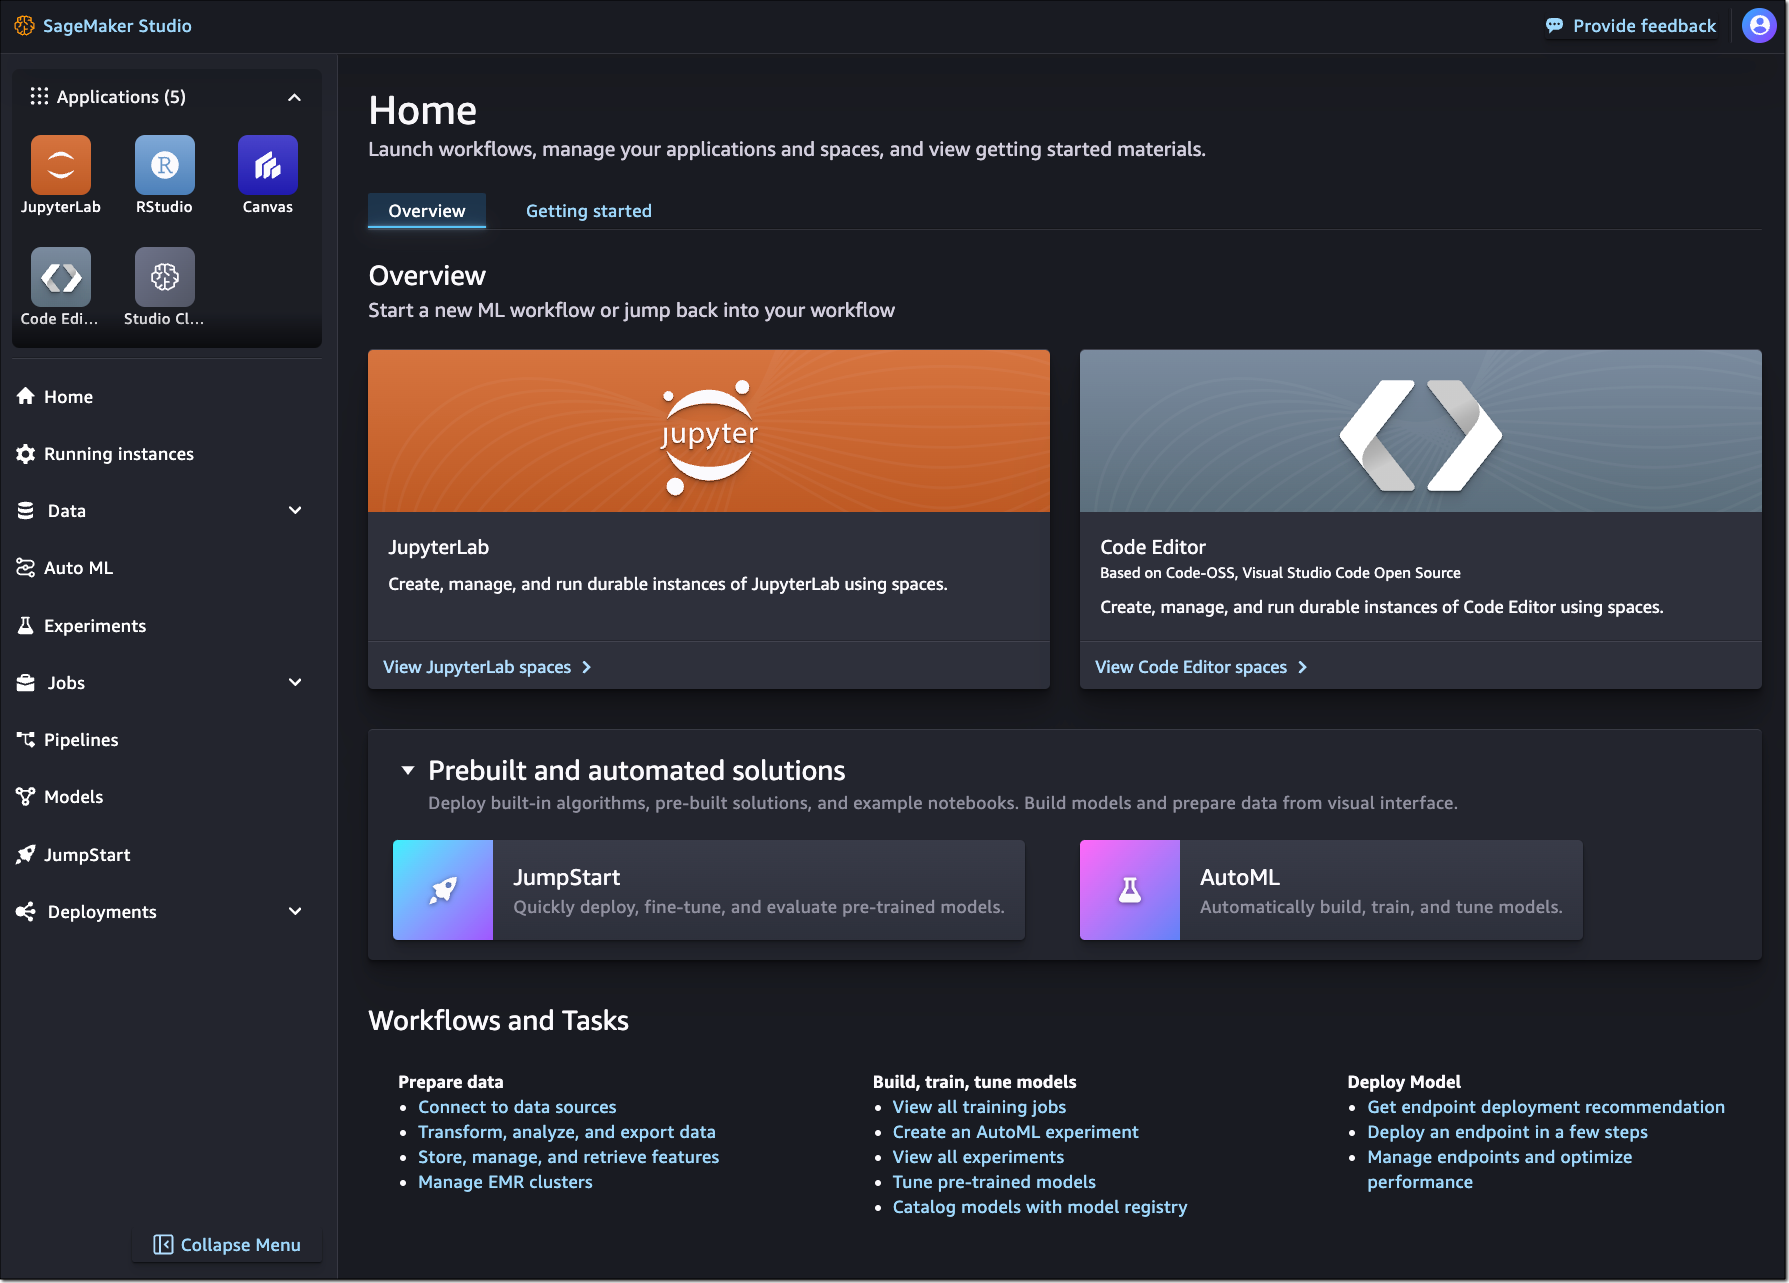
Today, we are announcing an improved Amazon SageMaker Studio experience! The new SageMaker Studio web-based interface loads faster and provides consistent access to your preferred integrated development environment (IDE) and SageMaker resources and tooling, irrespective of your IDE choice. In addition to JupyterLab and RStudio, SageMaker Studio now includes a fully managed Code Editor based on Code-OSS (Visual Studio Code Open Source).

Both Code Editor and JupyterLab can be launched using a flexible workspace. With spaces, you can scale the compute and storage for your IDE up and down as you go, customize runtime environments, and pause-and-resume coding anytime from anywhere. You can spin up multiple such spaces, each configured with a different combination of compute, storage, and runtimes.

SageMaker Studio now also comes with a streamlined onboarding and administration experience to help both individual users and enterprise administrators get started in minutes. Let me give you a quick tour of some of these highlights.

New SageMaker Studio web-based interface
The new SageMaker Studio web-based interface acts as a command center for launching your preferred IDE and accessing your SageMaker tools to build, train, tune, and deploy models. You can now view SageMaker training jobs and endpoints in SageMaker Studio and access foundation models (FMs) via SageMaker JumpStart. Also, you no longer need to manually upgrade SageMaker Studio.

Amazon SageMaker Studio

New Code Editor based on Code-OSS (Visual Studio Code Open Source)
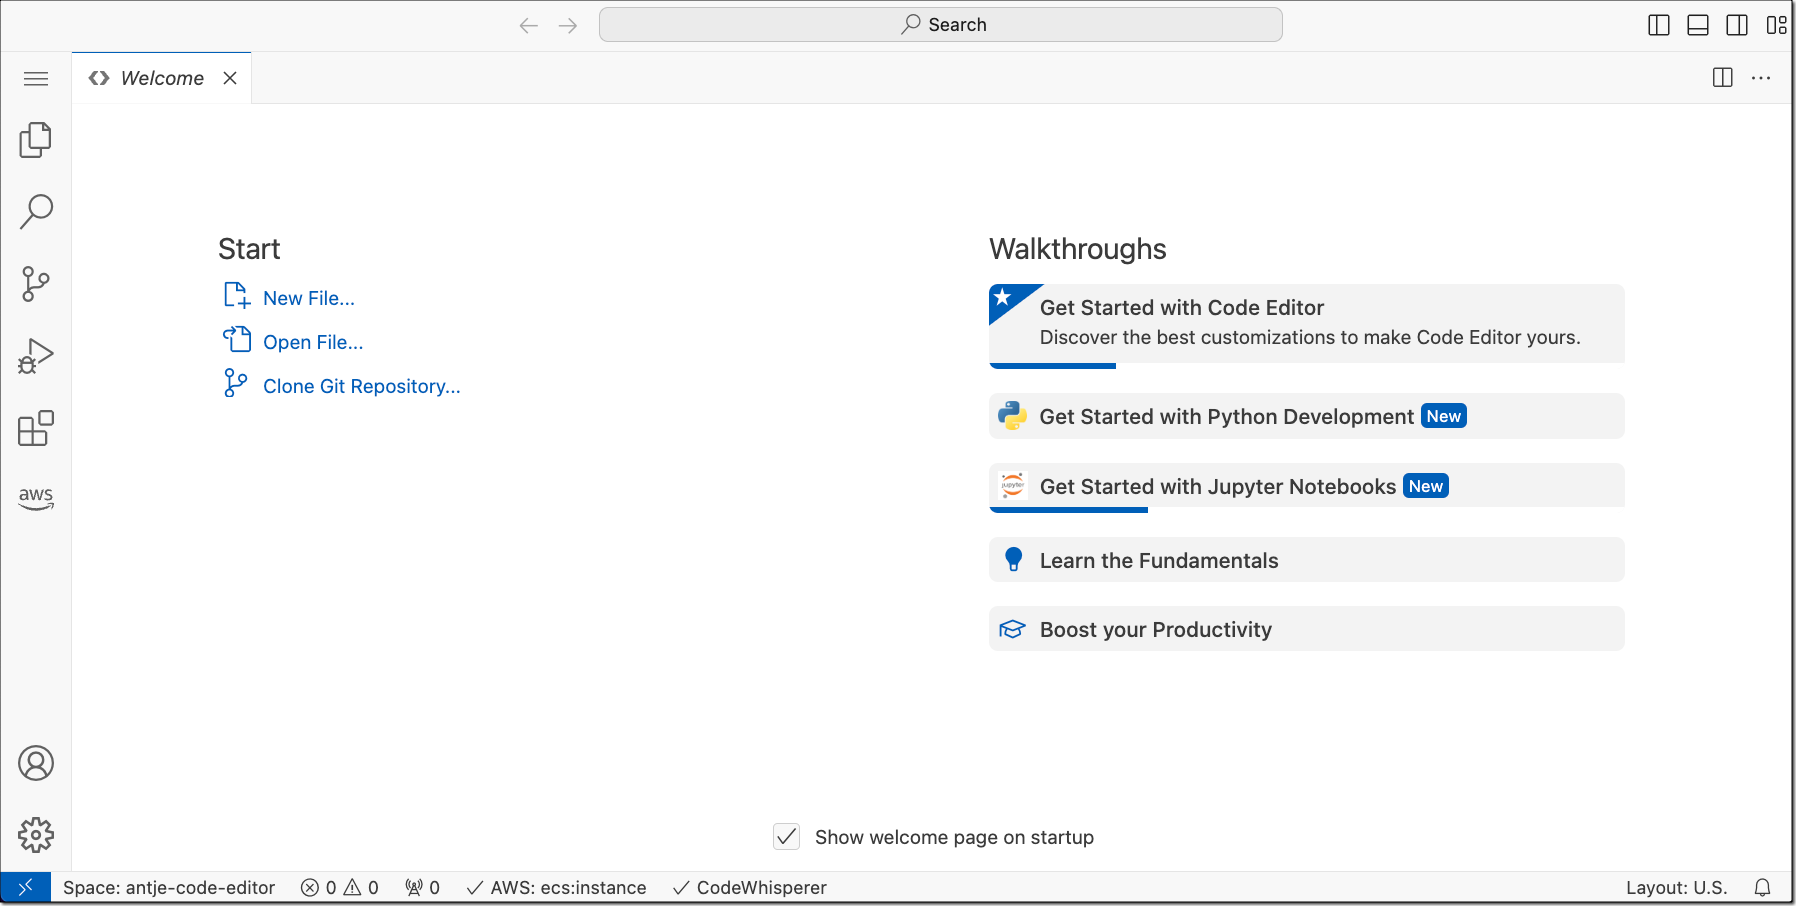
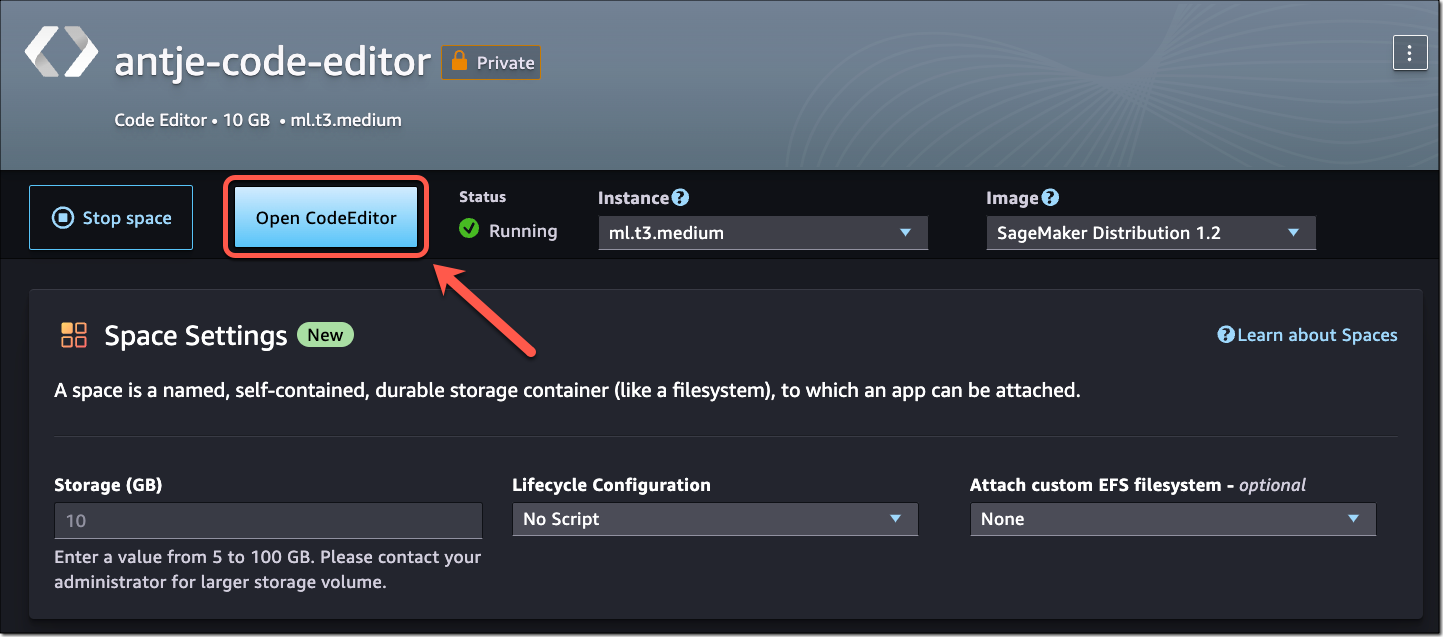
As a data scientist or machine learning (ML) practitioner, you can now sign in to SageMaker Studio and launch Code Editor directly from your browser. With Code Editor, you have access to thousands of VS Code compatible extensions from Open VSX registry and the preconfigured AWS toolkit for Visual Studio Code for developing and deploying applications on AWS. You can also use the artificial intelligence (AI)-powered coding companion and security scanning tool powered by Amazon CodeWhisperer and Amazon CodeGuru.

Amazon SageMaker Studio

Launch Code Editor and JupyterLab in a flexible workspace
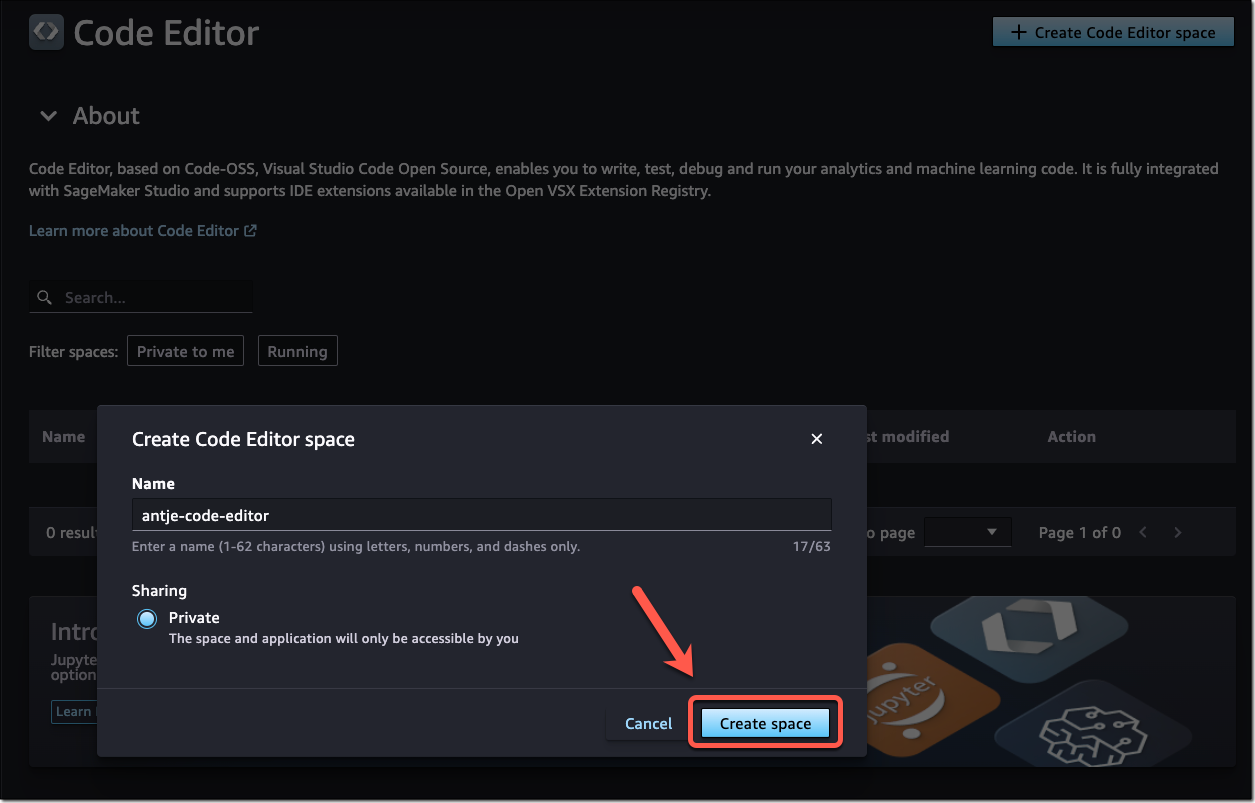
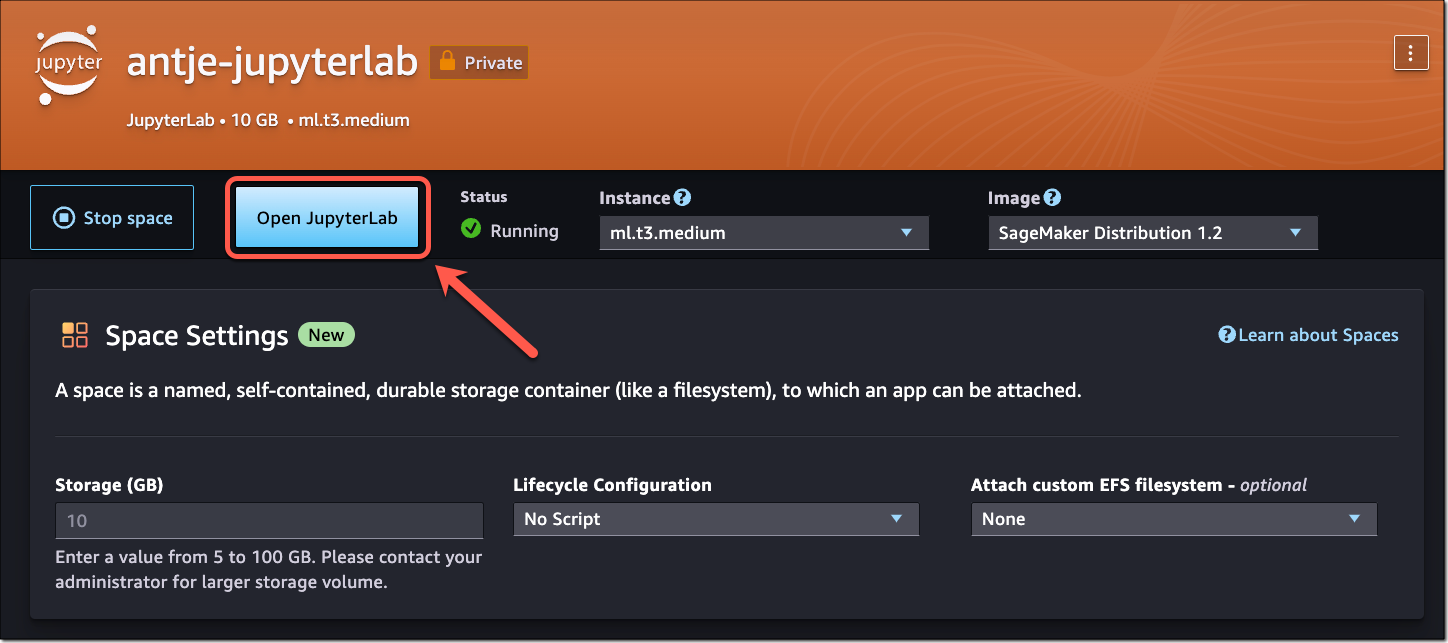
You can launch both Code Editor and JupyterLab using private spaces that only the user creating the space has access to. This flexible workspace is designed to provide a faster and more efficient coding environment.

The spaces come preconfigured with a SageMaker distribution that contains popular ML frameworks and Python packages. With the help of the AI-powered coding companions and security tools, you can quickly generate, debug, explain, and refactor your code.

In addition, SageMaker Studio comes with an improved collaboration experience. You can use the built-in Git integration to share and version code or bring your own shared file storage using Amazon EFS to access a collaborative filesystem across different users or teams.

Amazon SageMaker Studio

Amazon SageMaker Studio

Amazon SageMaker Studio

Streamlined user onboarding and administration
With redesigned setup and onboarding workflows, you can now set up SageMaker Studio domains within minutes. As an individual user, you can now use a one-click experience to launch SageMaker Studio using default presets and without the need to learn about domains or AWS IAM roles.

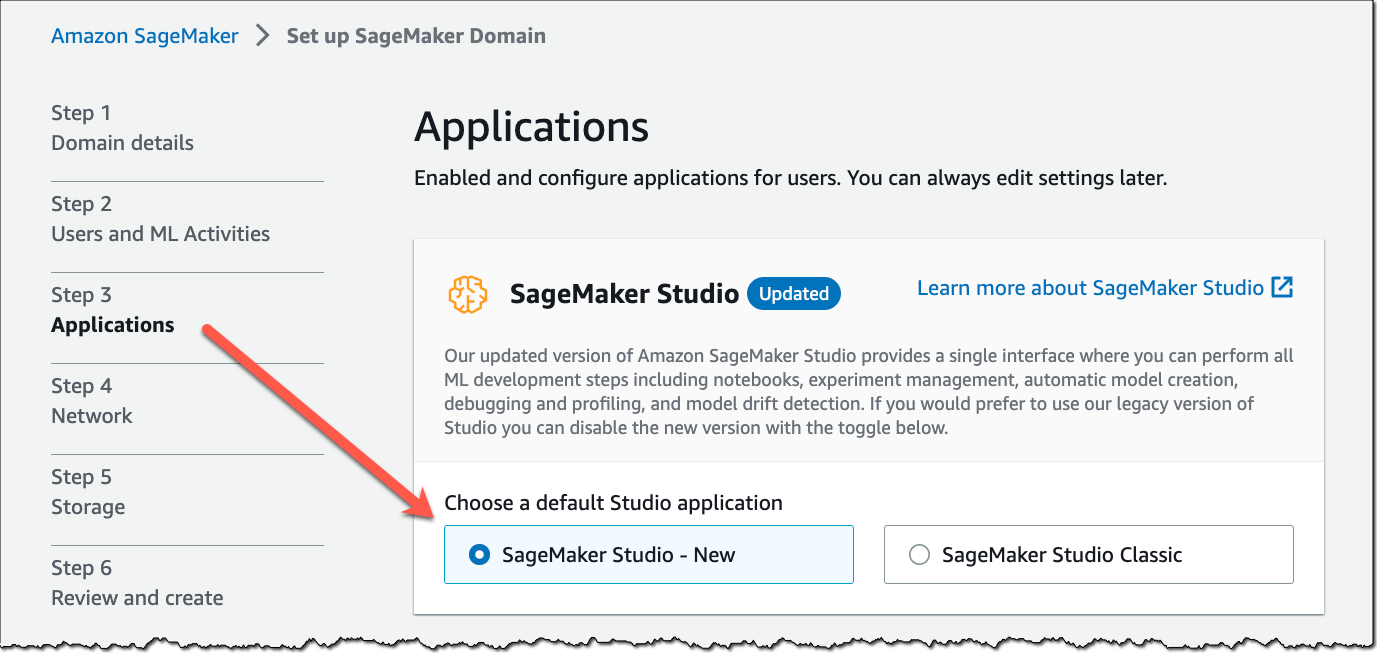
As an enterprise administrator, step-by-step instructions help you choose the right authentication method, connect to your third-party identity providers, integrate networking and security configurations, configure fine-grained access policies, and choose the right applications to enable in SageMaker Studio. You can also update settings at any time.

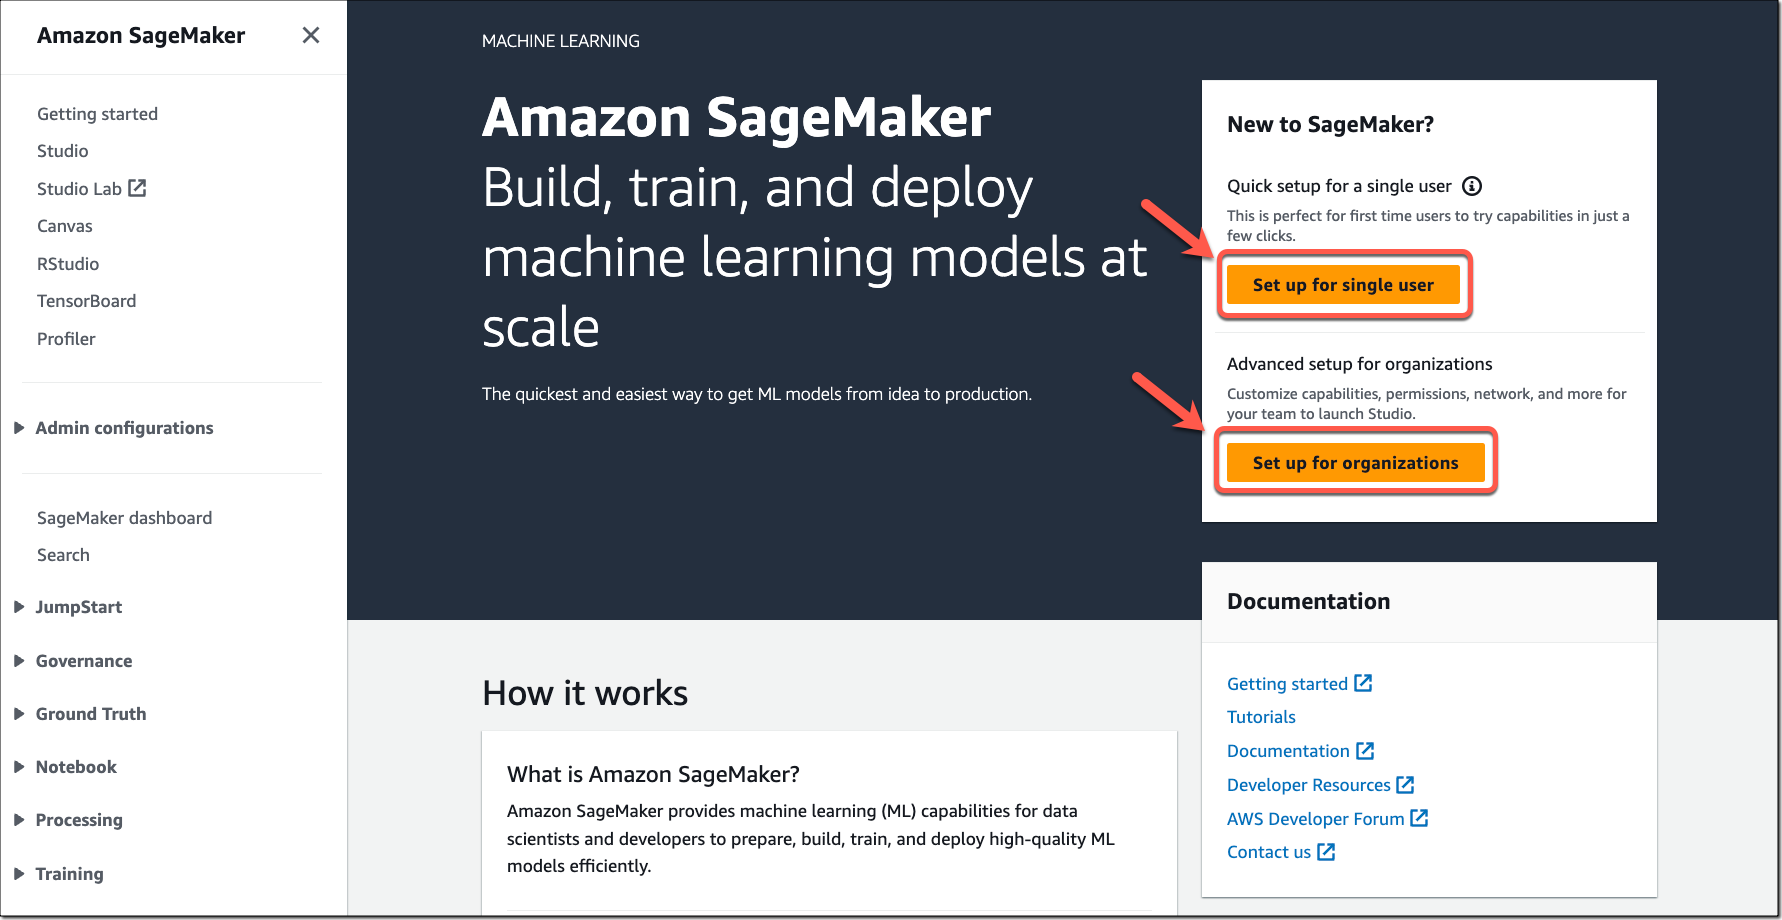
To get started, navigate to the SageMaker console and select either Set up for single user or Set up for organization.

Amazon SageMaker Studio

The single-user setup will start deploying a SageMaker Studio domain using default presets and will be ready within a few minutes. The setup for organizations will guide you through the configuration step-by-step. Note that you can choose to keep working with the classic SageMaker Studio experience or start exploring the new experience.

Amazon SageMaker Studio

Now available
The new Amazon SageMaker Studio experience is available today in all AWS Regions where SageMaker Studio is available. Starting today, new SageMaker Studio domains will default to the new web-based interface. If you have an existing setup and want to start using the new experience, check out the SageMaker Developer Guide for instructions on how to migrate your existing domains.

Give it a try, and let us know what you think. You can send feedback to AWS re:Post for Amazon SageMaker Studio or through your usual AWS contacts.

Start building your ML projects with Amazon SageMaker Studio today!

— Antje

Amazon CloudWatch Application Signals for automatic instrumentation of your applications (preview)

This post was originally published on this site

One of the challenges with distributed systems is that they are made up of many interdependent services, which add a degree of complexity when you are trying to monitor their performance. Determining which services and APIs are experiencing high latencies or degraded availability requires manually putting together telemetry signals. This can result in time and effort establishing the root cause of any issues with the system due to the inconsistent experiences across metrics, traces, logs, real user monitoring, and synthetic monitoring.

You want to provide your customers with continuously available and high-performing applications. At the same time, the monitoring that assures this must be efficient, cost-effective, and without undifferentiated heavy lifting.

Amazon CloudWatch Application Signals helps you automatically instrument applications based on best practices for application performance. There is no manual effort, no custom code, and no custom dashboards. You get a pre-built, standardized dashboard showing the most important metrics, such as volume of requests, availability, latency, and more, for the performance of your applications. In addition, you can define Service Level Objectives (SLOs) on your applications to monitor specific operations that matter most to your business. An example of an SLO could be to set a goal that a webpage should render within 2000 ms 99.9 percent of the time in a rolling 28-day interval.

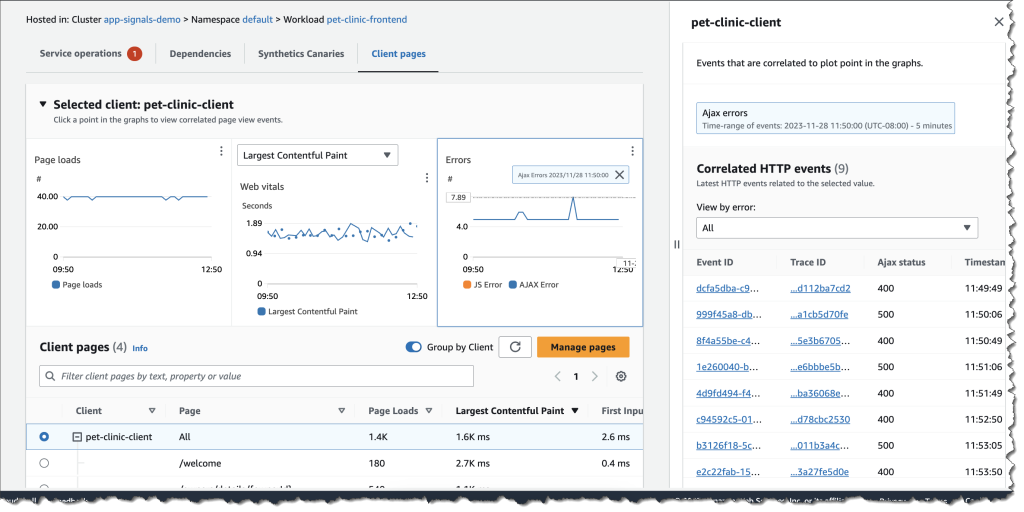
Application Signals automatically correlates telemetry across metrics, traces, logs, real user monitoring, and synthetic monitoring to speed up troubleshooting and reduce application disruption. By providing an integrated experience for analyzing performance in the context of your applications, Application Signals gives you improved productivity with a focus on the applications that support your most critical business functions.

My personal favorite is the collaboration between teams that’s made possible by Application Signals. I started this post by mentioning that distributed systems are made up of many interdependent services. On the Service Map, which we will look at later in this post, if you, as a service owner, identify an issue that’s caused by another service, you can send a link to the owner of the other service to efficiently collaborate on the triage tasks.

Getting started with Application Signals
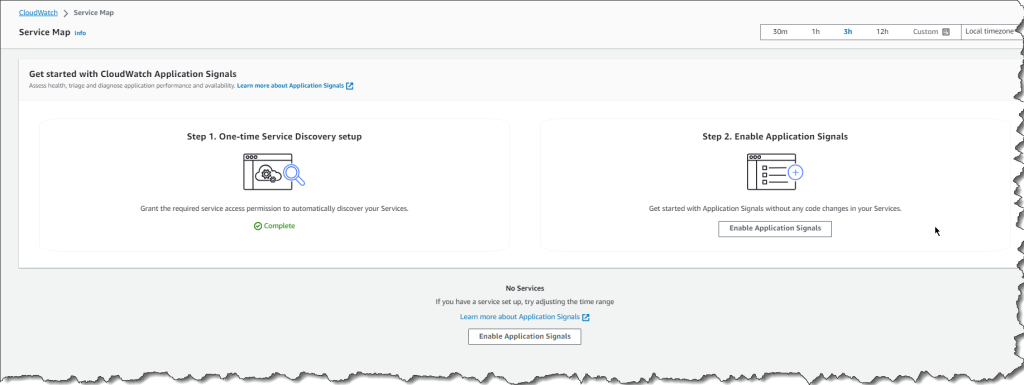
You can easily collect application and container telemetry when creating new Amazon EKS clusters in the Amazon EKS console by enabling the new Amazon CloudWatch Observability EKS add-on. Another option is to enable for existing Amazon EKS Clusters or other compute types directly in the Amazon CloudWatch console.

Create service map

After enabling Application Signals via the Amazon EKS add-on or Custom option for other compute types, Application Signals automatically discovers services and generates a standard set of application metrics such as volume of requests and latency spikes or availability drops for APIs and dependencies, to name a few.

Specify platform

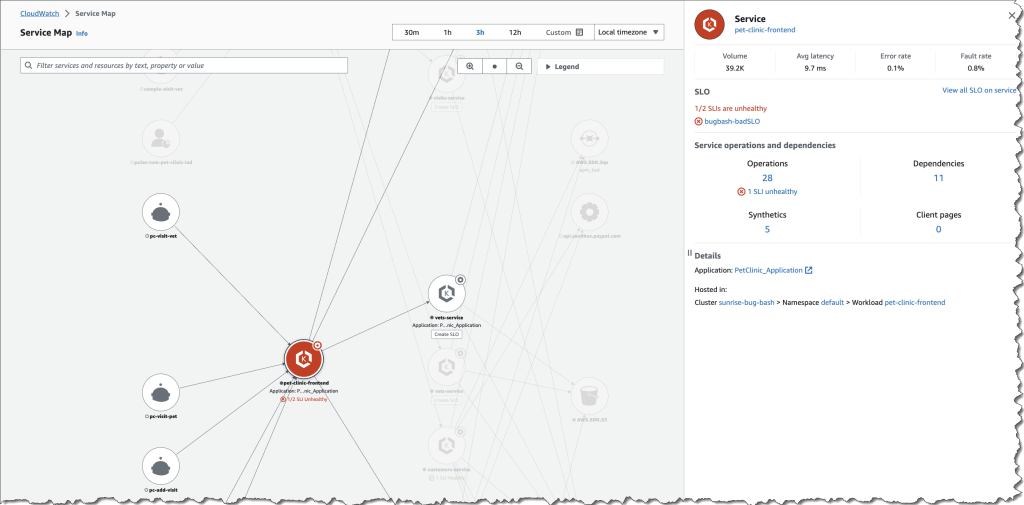
All of the services discovered and their golden metrics (volume of requests, latency, faults and errors) are then automatically displayed on the Services page and the Service Map. The Service Map gives you a visual deep dive to evaluate the health of a service, its operations, dependencies, and all the call paths between an operation and a dependency.

Auto-generated map

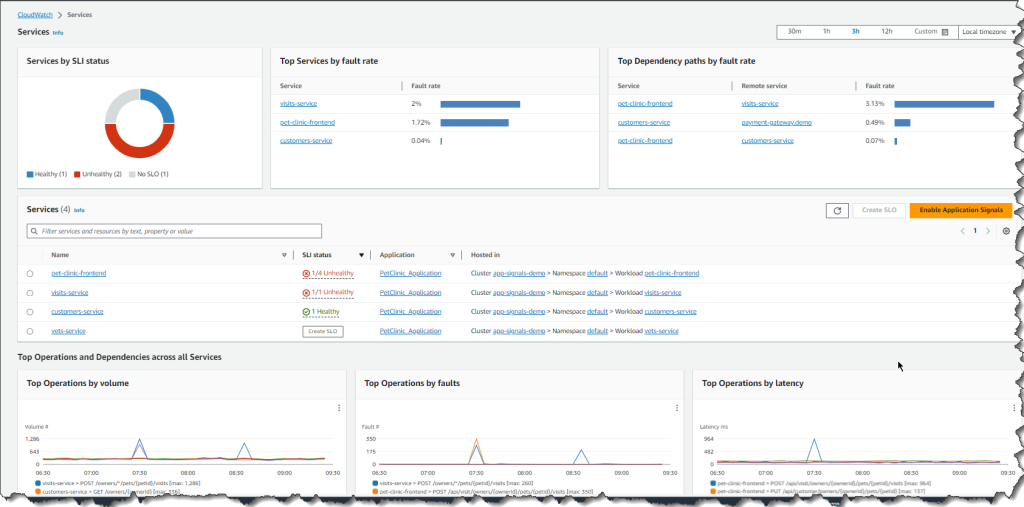
The list of services that are enabled in Application Signals will also show in the services dashboard, along with operational metrics across all of your services and dependencies to easily spot anomalies. The Application column is auto-populated if the EKS cluster belongs to an application that’s tagged in AppRegistry. The Hosted In column automatically detects which EKS pod, cluster, or namespace combination the service requests are running in, and you can select one to go directly to Container Insights for detailed container metrics such as CPU or memory utilization, to name a few.

Team collaboration with Application Signals
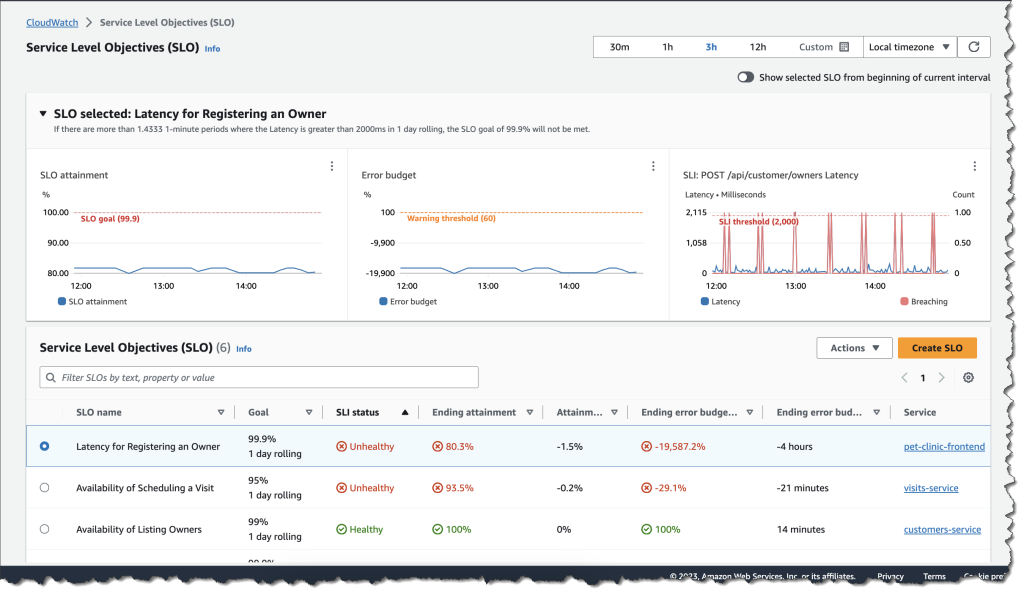
Now, to expand on the team collaboration that I mentioned at the beginning of this post. Let’s say you consult the services dashboard to do sanity checks and you notice two SLO issues for one of your services named pet-clinic-frontend. Your company maintains a set of SLOs, and this is the view that you use to understand how the applications are performing against the objectives. For the services that are tagged in AppRegistry all teams have a central view of the definition and ownership of the application. Further navigation to the service map gives you even more details on the health of this service.

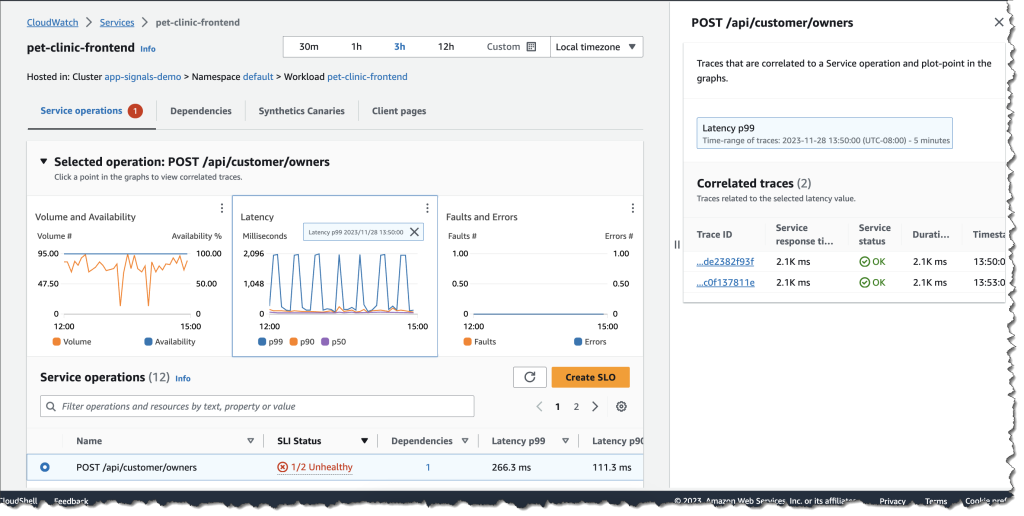
At this point you make the decision to send the link to thepet-clinic-frontendservice to Sarah whose details you found in the AppRegistry. Sarah is the person on-call for this service. The link allows you to efficiently collaborate with Sarah because it’s been curated to land directly on the triage view that is contextualized based on your discovery of the issue. Sarah notices that the POST /api/customer/owners latency has increased to 2k ms for a number of requests and as the service owner, dives deep to arrive at the root cause.

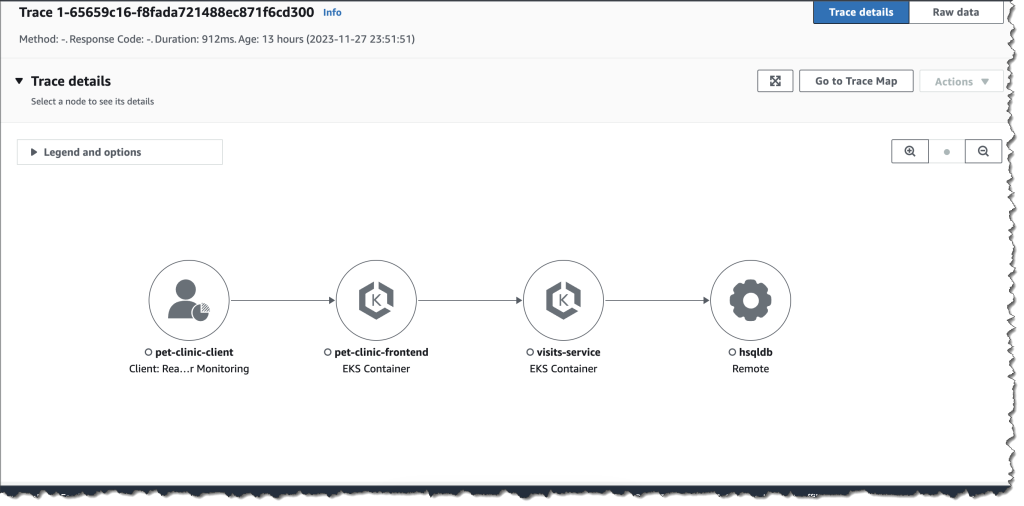
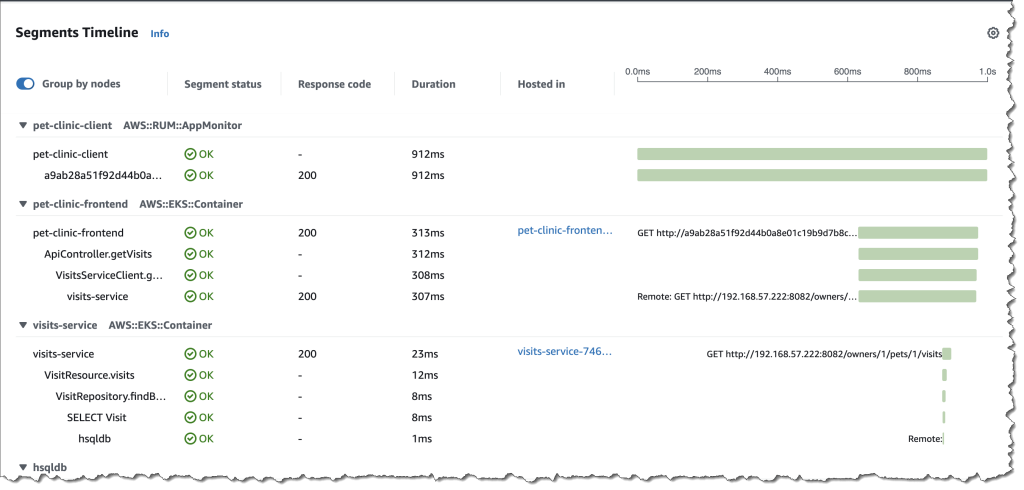
Clicking into the latency graph returns a correlated list of traces that correspond directly to the operation, metric, and moment in time, which helps Sarah to find the exact traces that may have led to the increase in latency.

Sarah uses Amazon CloudWatch Synthetics and Amazon CloudWatch RUM and has enabled the X-Ray active tracing integration to automatically see the list of relevant canaries and pages correlated to the service. This integrated view now helps Sarah gain multiple perspectives in the performance of the application and quickly troubleshoot anomalies in a single view.

Available now
Amazon CloudWatch Application Signals is available in preview and you can start using it today in the following AWS Regions: US East (N. Virginia), US East (Ohio), US West (Oregon), Europe (Ireland), Asia Pacific (Sydney), and Asia Pacific (Tokyo).

To learn more, visit the Amazon CloudWatch user guide and the One Observability Workshop. You can submit your questions to AWS re:Post for Amazon CloudWatch, or through your usual AWS Support contacts.

Veliswa

New myApplications in the AWS Management Console simplifies managing your application resources

This post was originally published on this site

Today, we are announcing the general availability of myApplications supporting application operations, a new set of capabilities that help you get started with your applications on AWS, operate them with less effort, and move faster at scale. With myApplication in the AWS Management Console, you can more easily manage and monitor the cost, health, security posture, and performance of your applications on AWS.

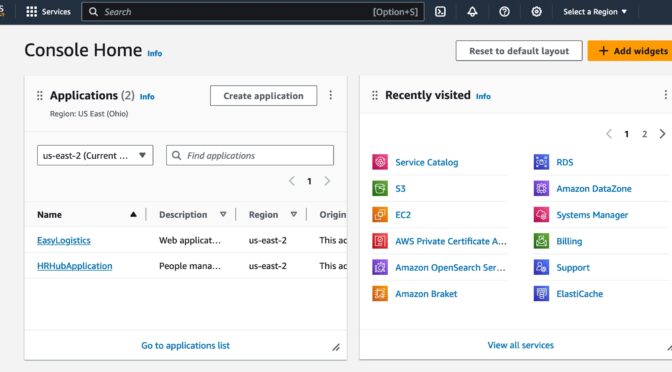
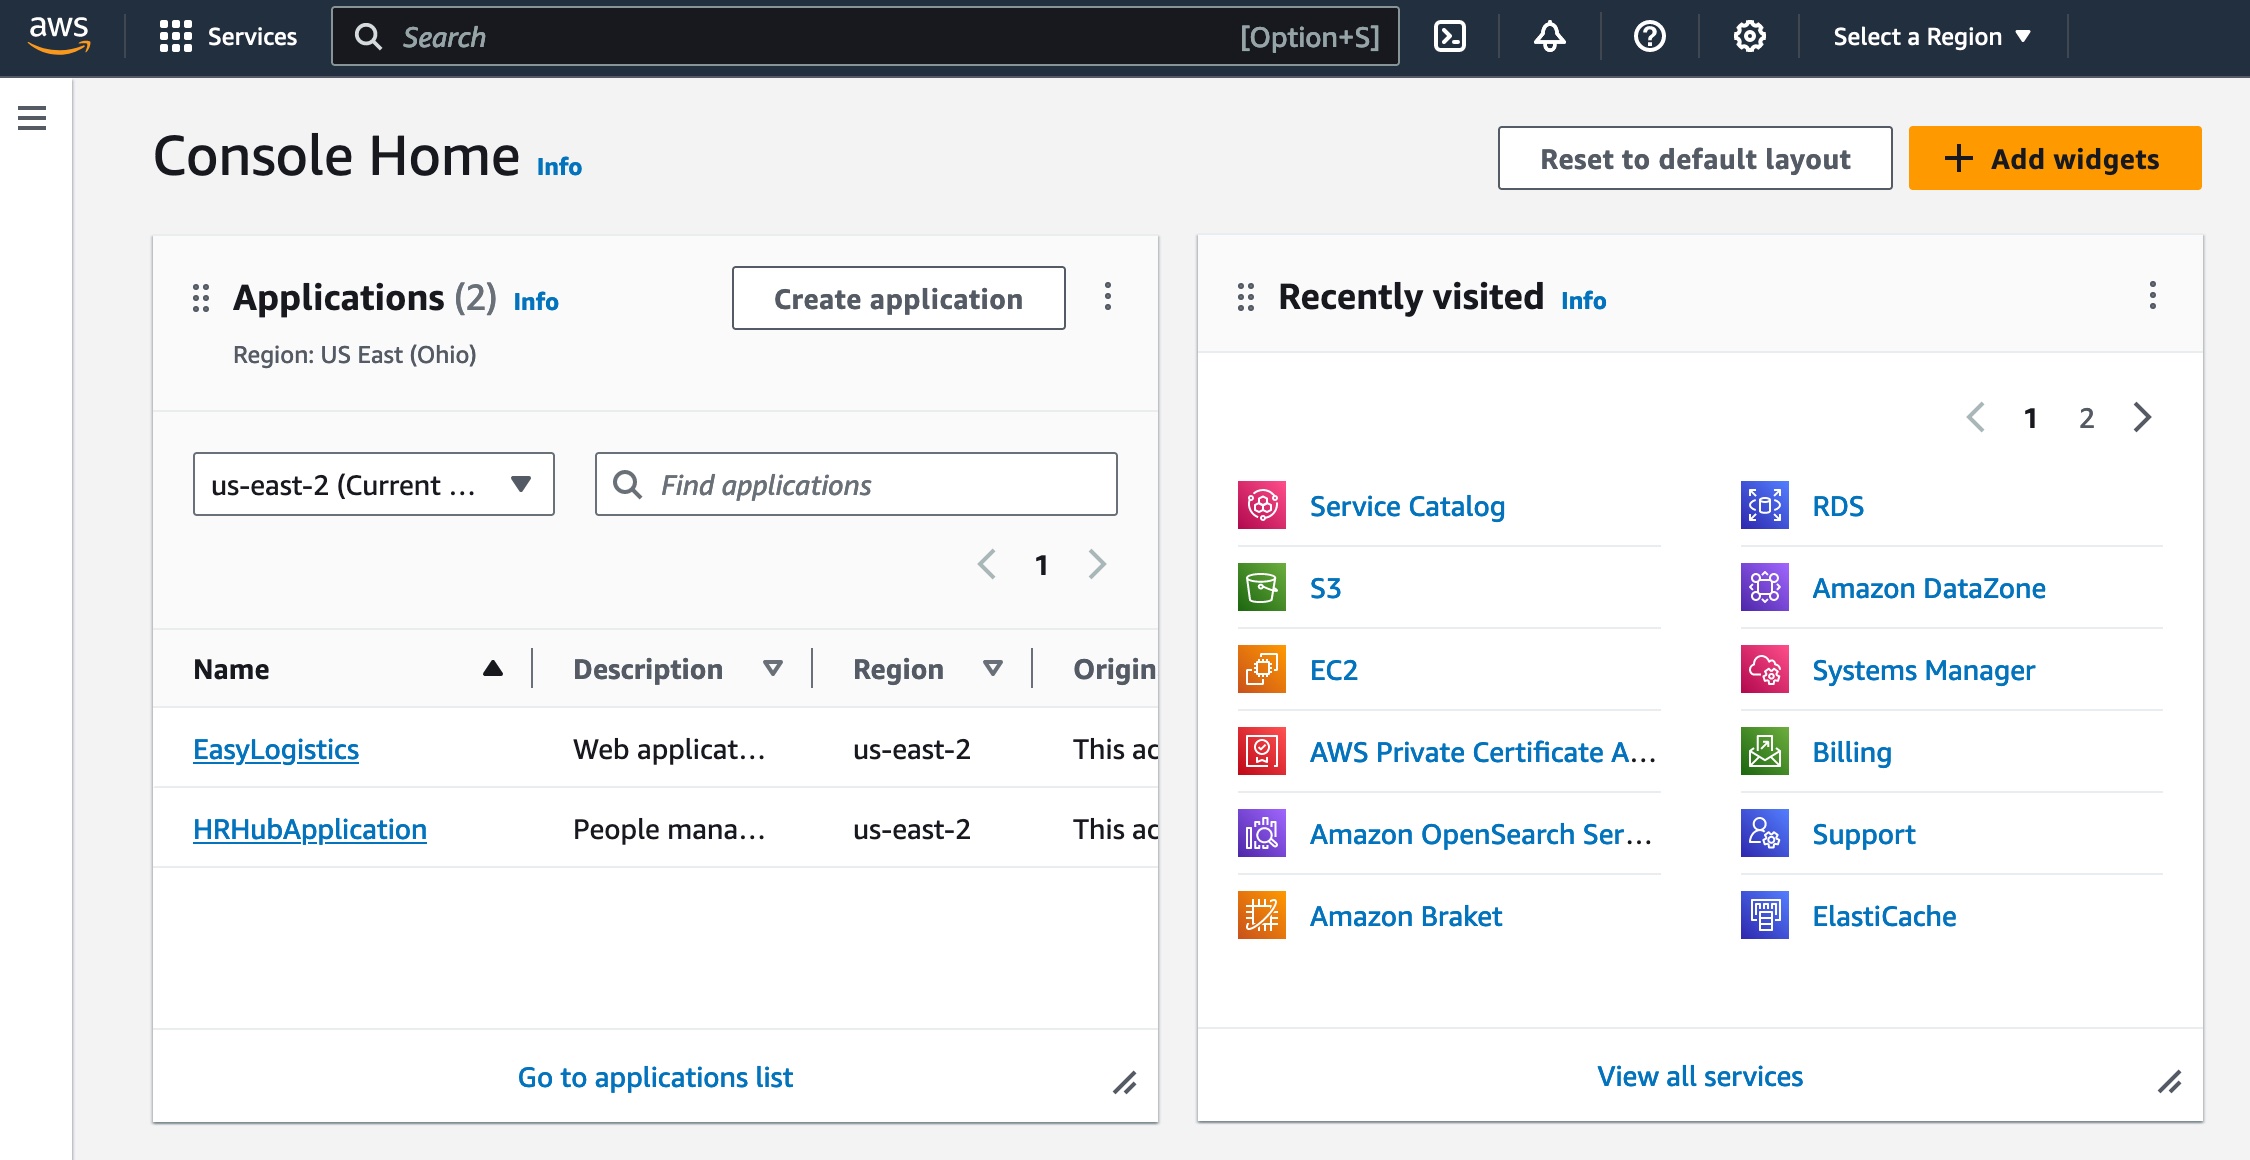
The myApplications experience is available in the Console Home, where you can access an Applications widget that lists the applications in an account. Now, you can create your applications more easily using the Create application wizard, connecting resources in your AWS account from one view in the console. The created application will automatically display in myApplications, and you can take action on your applications.

When you choose your application in the Applications widget in the console, you can see an at-a-glance view of key application metrics widgets in the applications dashboard. Here you can find, debug operational issues, and optimize your applications.

With a single action on the applications dashboard, you can dive deeper to act on specific resources in the relevant services, such as Amazon CloudWatch for application performance, AWS Cost Explorer for cost and usage, and AWS Security Hub for security findings.

Getting started with myApplications
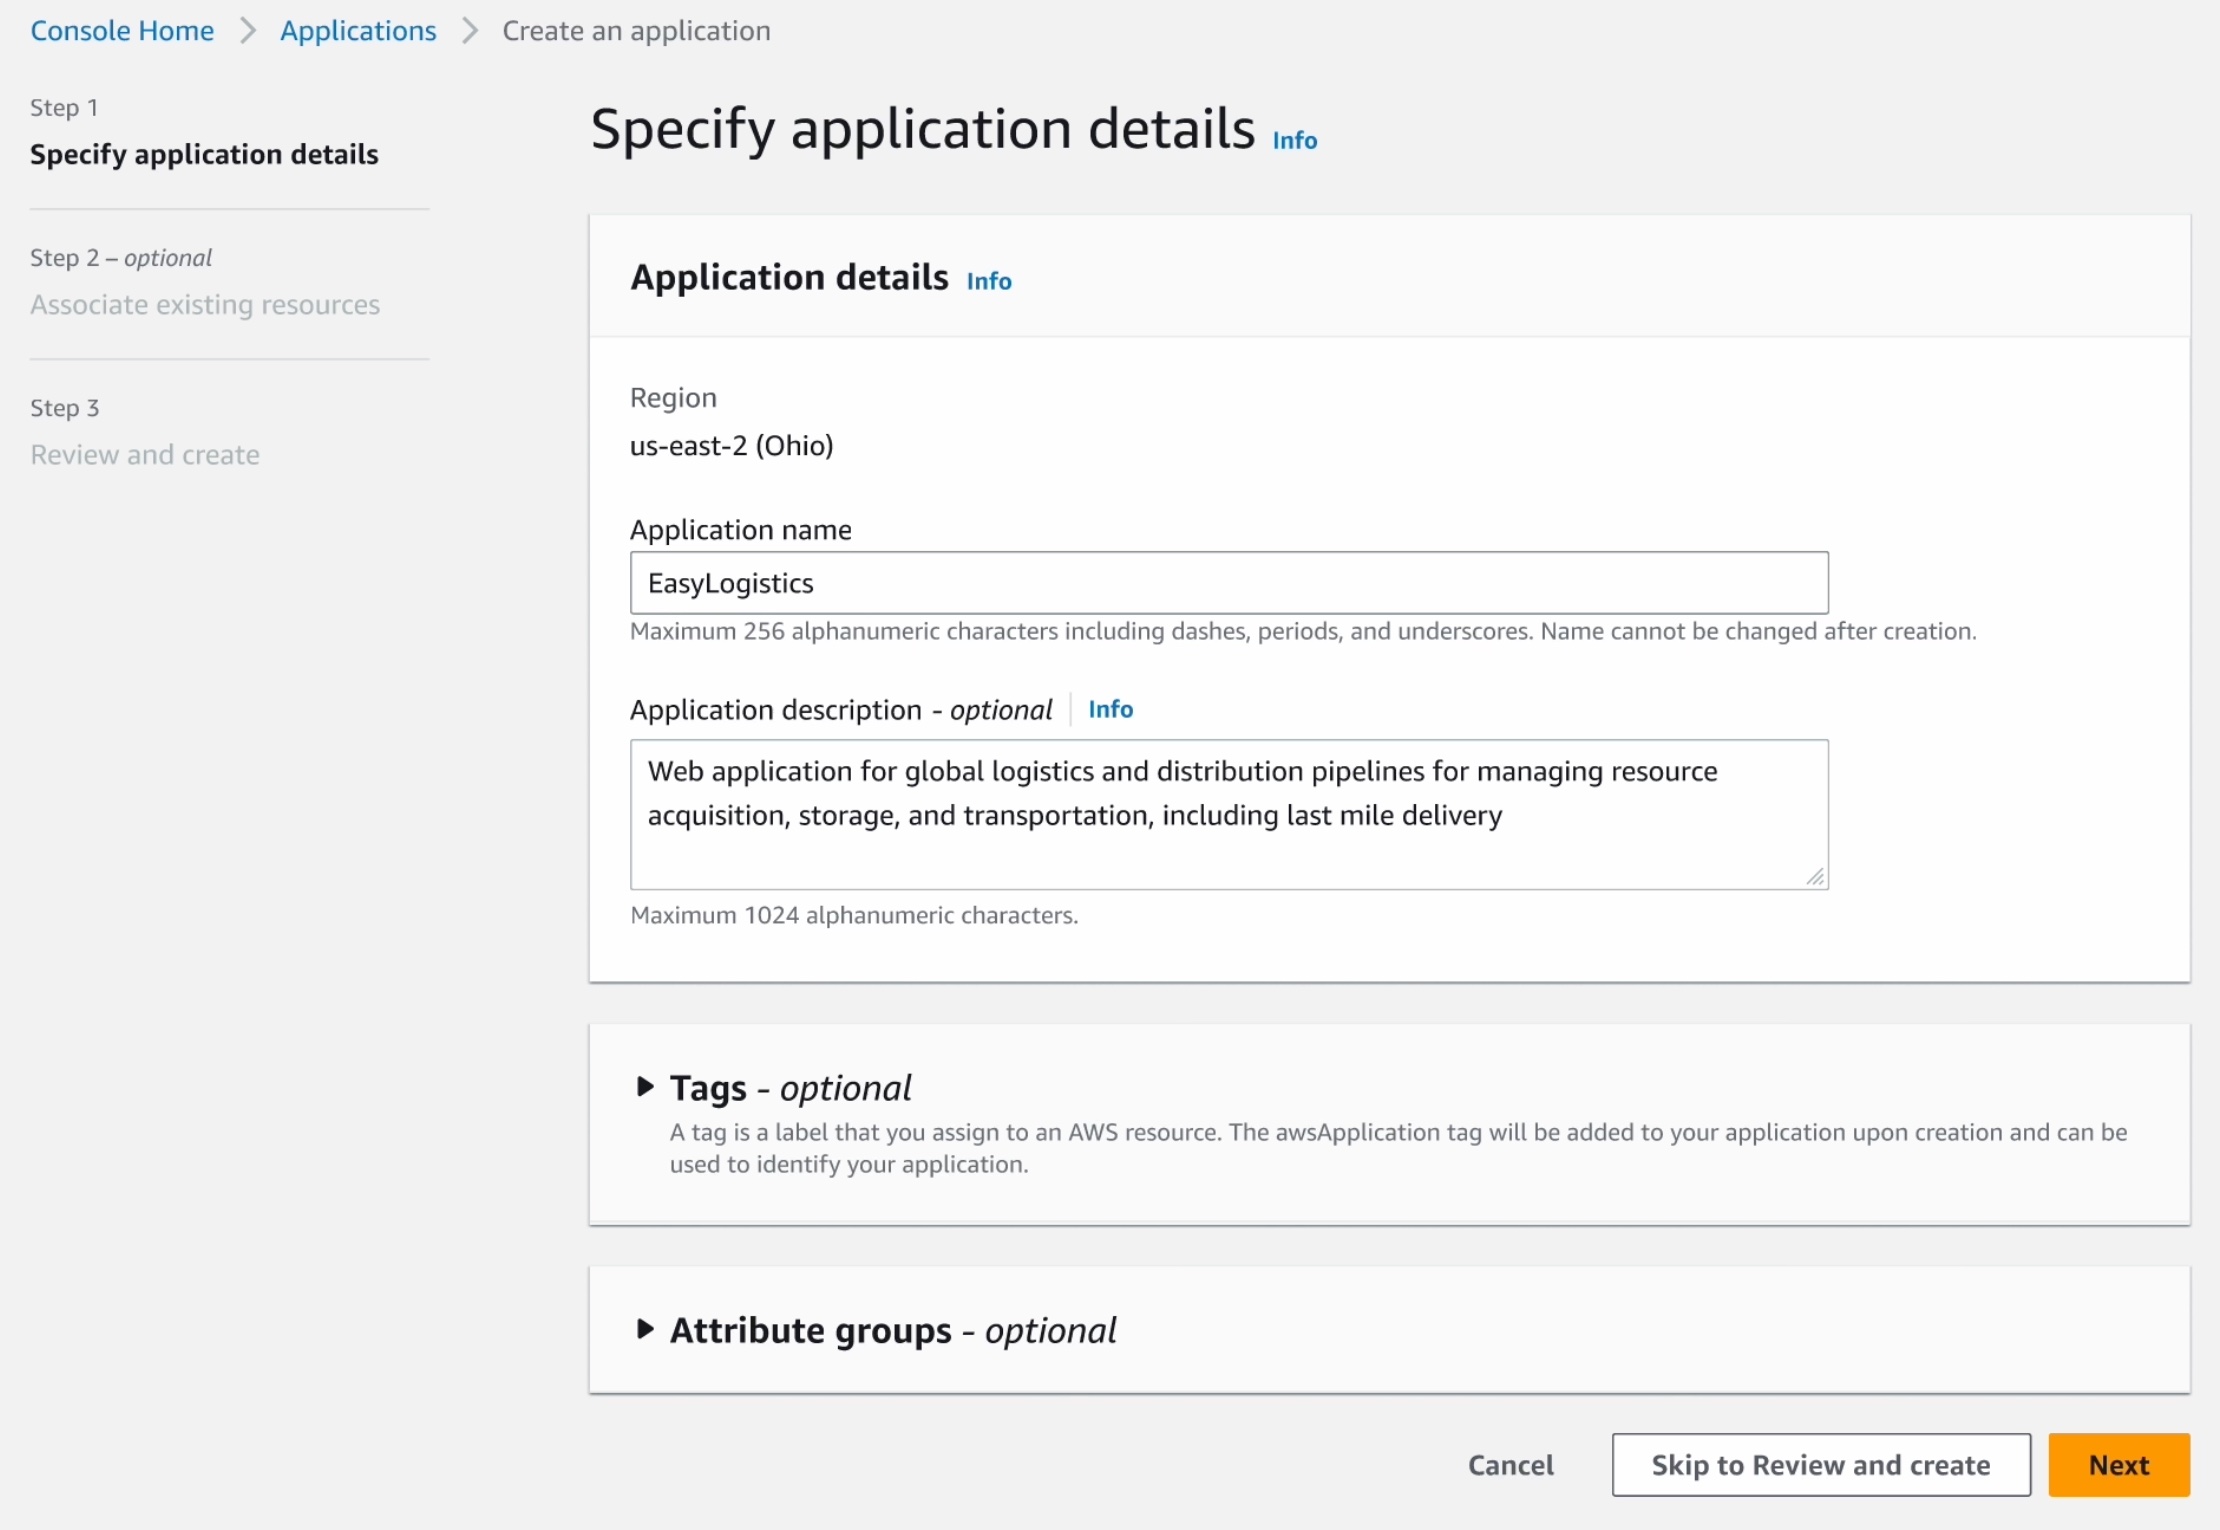
To get started, on the AWS Management Console Home, choose Create application in the Applications widget. In the first step, input your application name and description.

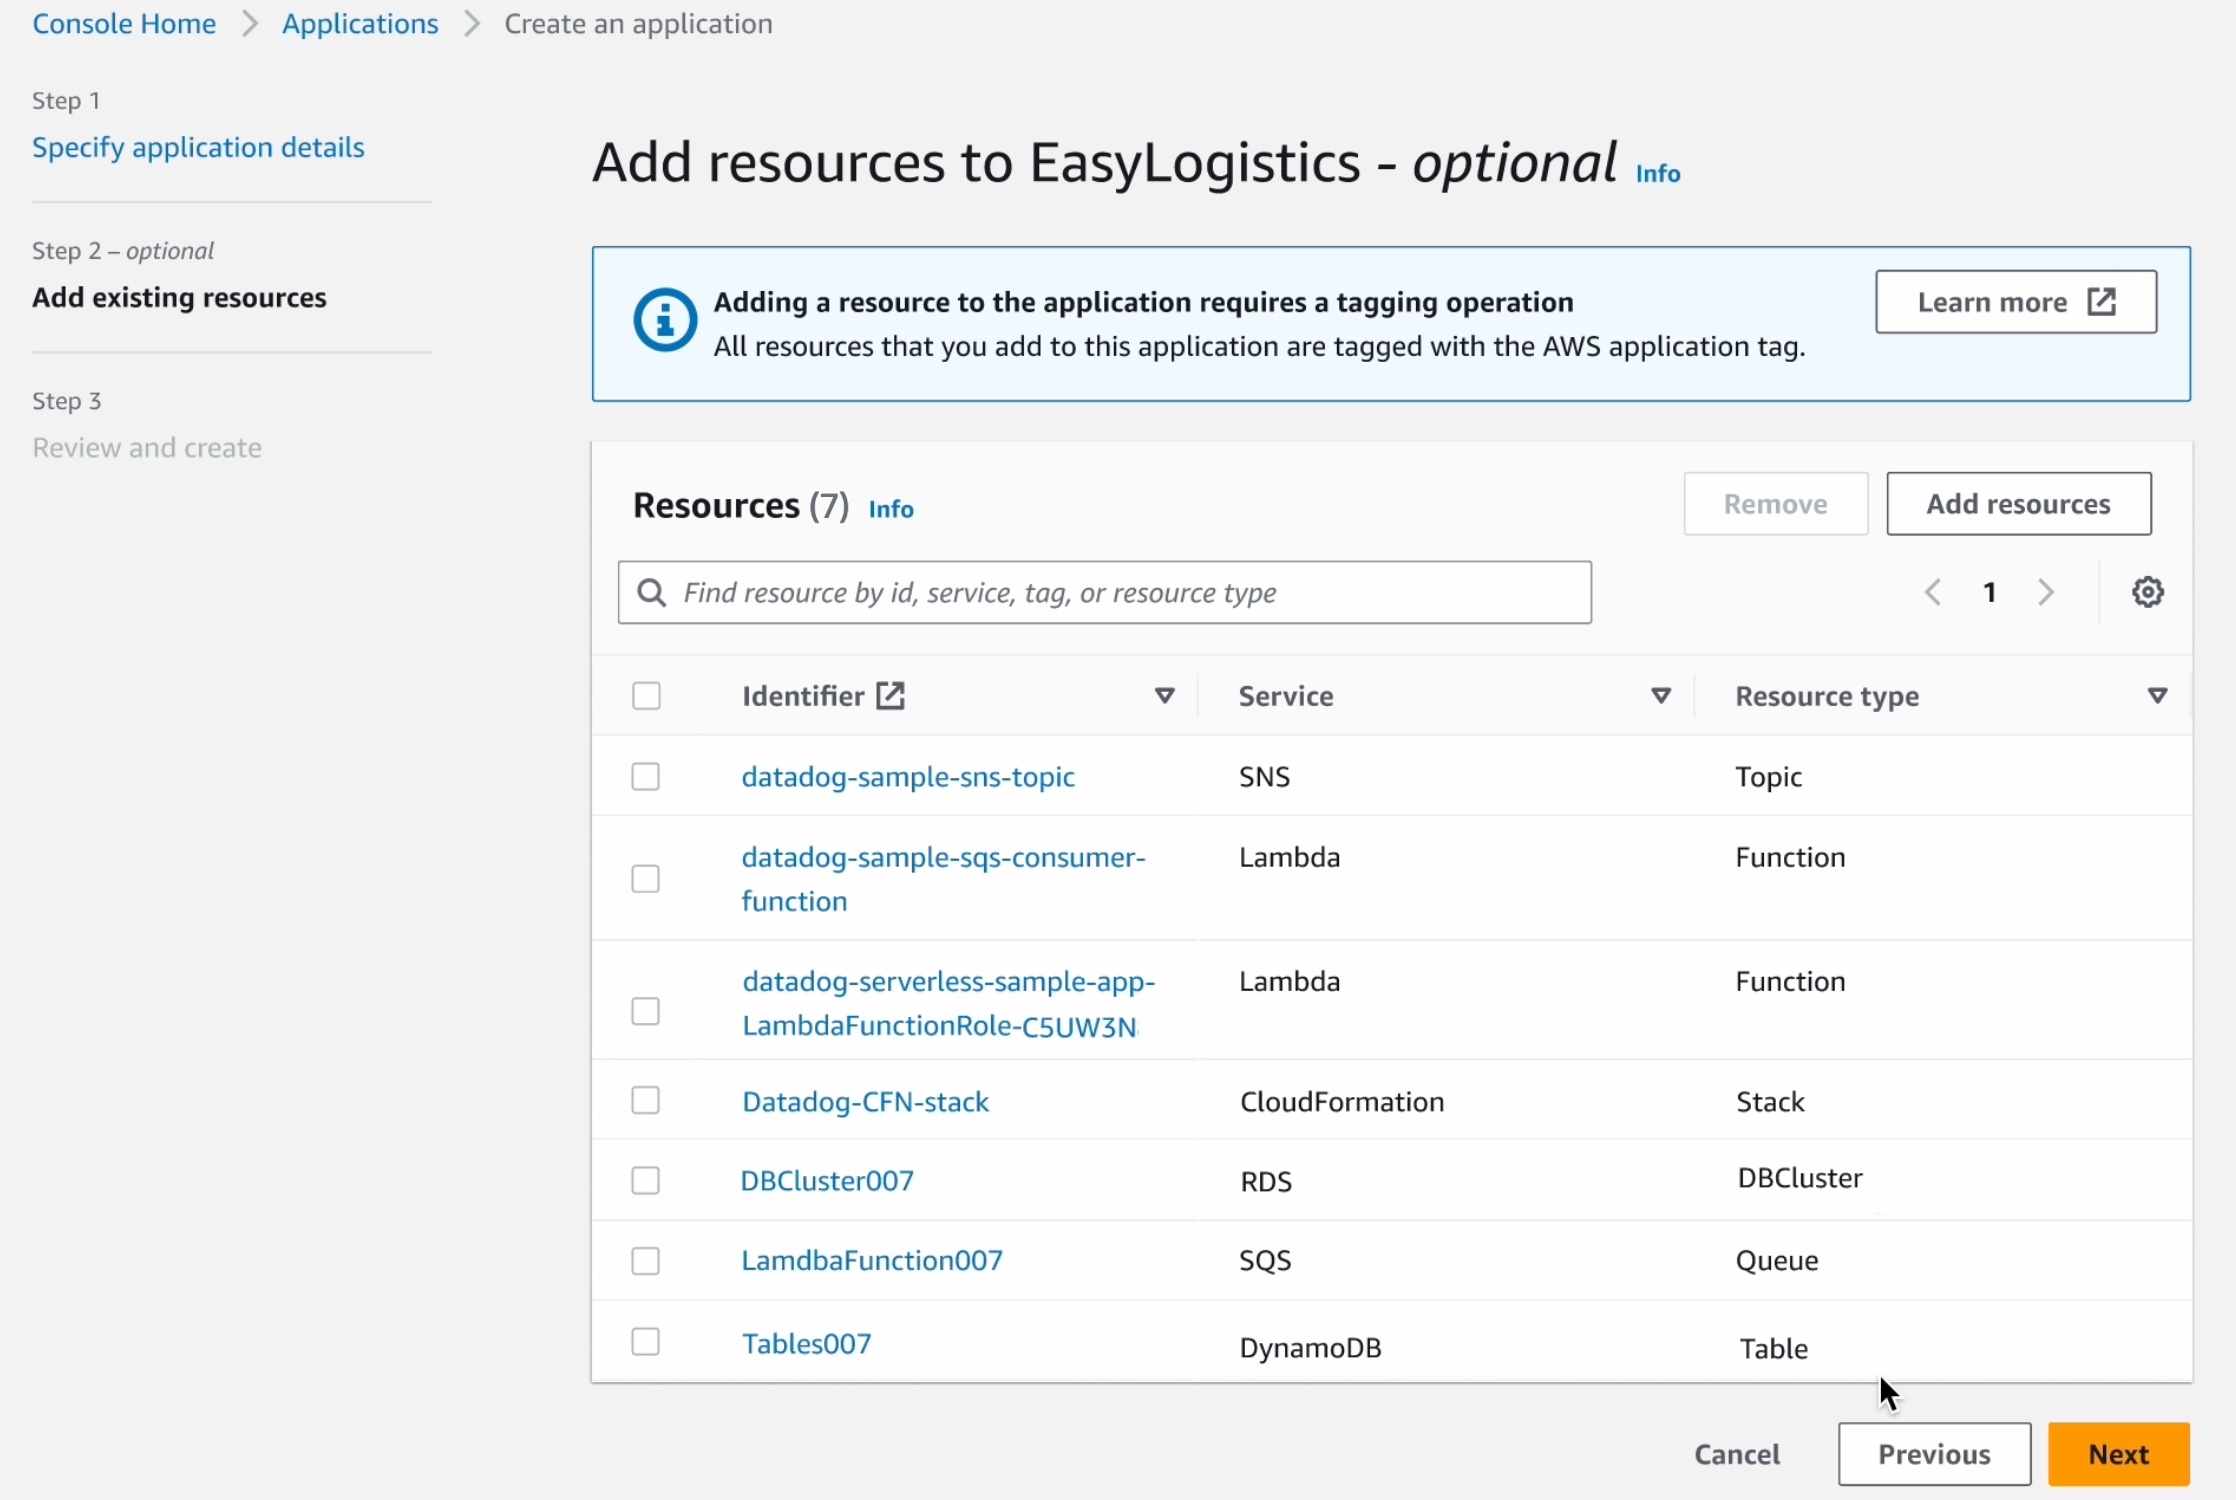
In the next step, you can add your resources. Before you can search and add resources, you should turn on and set up AWS Resource Explorer, a managed capability that simplifies the search and discovery of your AWS resources across AWS Regions.

Choose Add resources and select the resources to add to your applications. You can also search by keyword, tag, or AWS CloudFormation stack to integrate groups of resources to manage the full lifecycle of your application.

After confirming, your resources are added, new awsApplication tags applied, and the myApplications dashboard will be automatically generated.

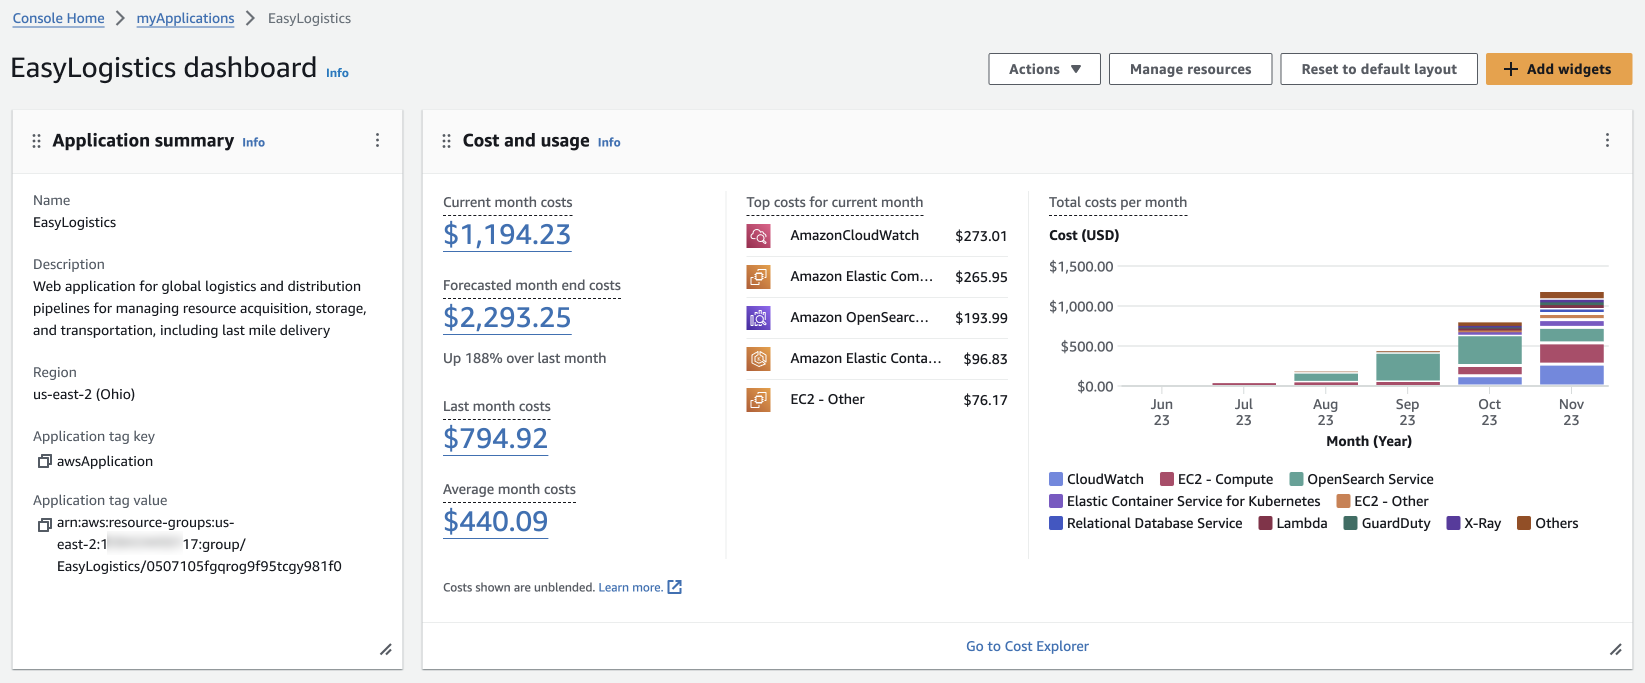
Now, let’s see which widgets can be useful.

The Application summary widget displays the name, description, and tag so you know which application you are working on. The Cost and usage widget visualizes your AWS resource costs and usage from AWS Cost Explorer, including the application’s current and forecasted month-end costs, top five billed services, and a monthly application resource cost trend chart. You can monitor spend, look for anomalies, and click to take action where needed.

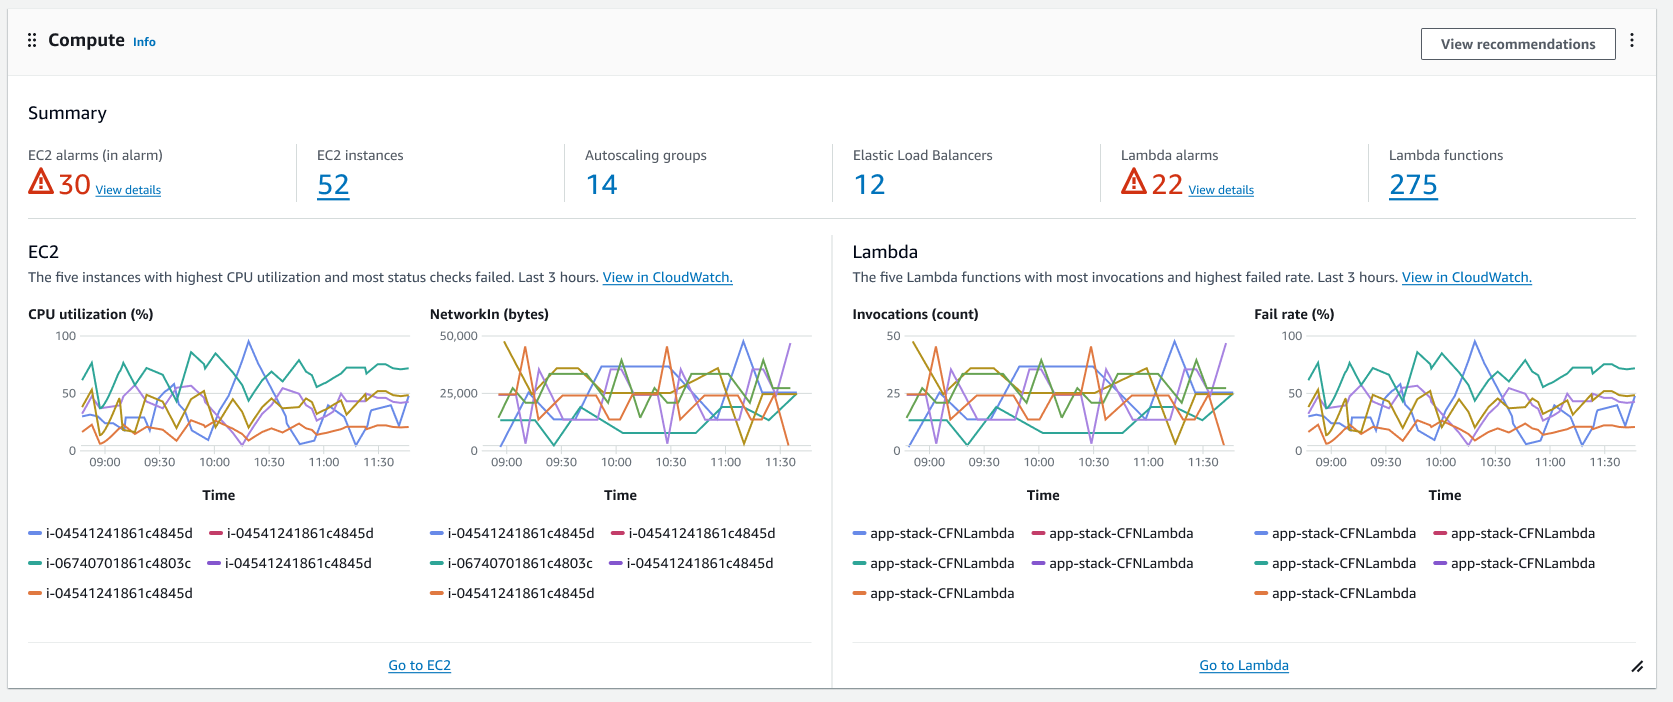
The Compute widget summarizes of application compute resources, information about which are in alarm, and trend charts from CloudWatch showing basic metrics such as Amazon EC2 instance CPU utilization and AWS Lambda invocations. You also can assess application operations, look for anomalies, and take action.

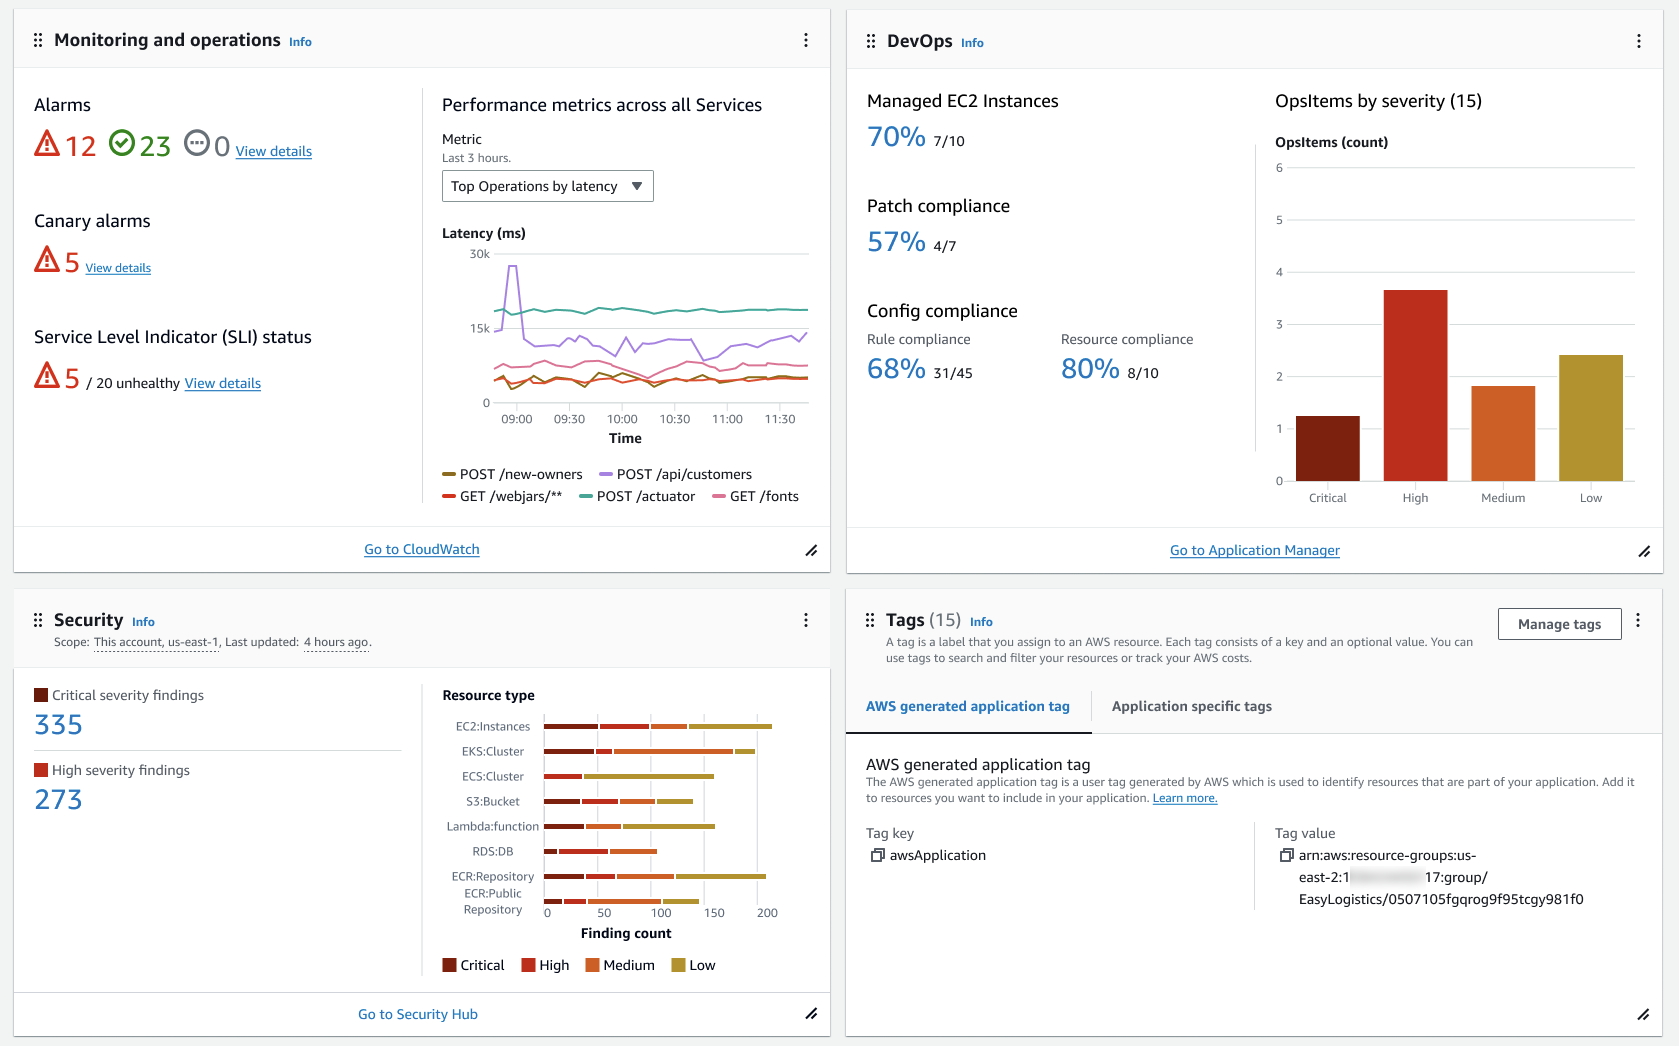
The Monitoring and Operations widget displays alarms and alerts for resources associated with your application, service level objectives (SLOs), and standardized application performance metrics from CloudWatch Application Signals. You can monitor ongoing issues, assess trends, and quickly identify and drill down on any issues that might impact your application.

The Security widget shows the highest priority security findings identified by AWS Security Hub. Findings are listed by severity and service, so you can monitor their security posture and click to take action where needed.

The DevOps widget summarizes operational insights from AWS System Manager Application Manager, such as fleet management, state management, patch management, and configuration management status so you can assess compliance and take action.

You can also use the Tagging widget to assist you in reviewing and applying tags to your application.

Now available
You can enjoy this new myApplications capability, a new application-centric experience to easily manage and monitor applications on AWS. myApplications capability is available in the following AWS Regions: US East (Ohio, N. Virginia), US West (N. California, Oregon), South America (São Paulo), Asia Pacific (Hyderabad, Jakarta, Mumbai, Osaka, Seoul, Singapore, Sydney, Tokyo), Europe (Frankfurt, Ireland, London, Paris, Stockholm), Middle East (Bahrain) Regions.

AWS Premier Tier Services Partners— Escala24x7, IBM, Tech Mahindra, and Xebia will support application operations with complementary features and services.

Give it a try now in the AWS Management Console and send feedback to AWS re:Post for AWS Management Console, using the feedback link on the myApplications dashboard, or through your usual AWS Support contacts.

Channy

Easily deploy SaaS products with new Quick Launch in AWS Marketplace

This post was originally published on this site

Today we are excited to announce the general availability of SaaS Quick Launch, a new feature in AWS Marketplace that makes it easy and secure to deploy SaaS products.

Before SaaS Quick Launch, configuring and launching third-party SaaS products could be time-consuming and costly, especially in certain categories like security and monitoring. Some products require hours of engineering time to manually set up permissions policies and cloud infrastructure. Manual multistep configuration processes also introduce risks when buyers rely on unvetted deployment templates and instructions from third-party resources.

SaaS Quick Launch helps buyers make the deployment process easy, fast, and secure by offering step-by-step instructions and resource deployment using preconfigured AWS CloudFormation templates. The software vendor and AWS validate these templates to ensure that the configuration adheres to the latest AWS security standards.

Getting started with SaaS Quick Launch
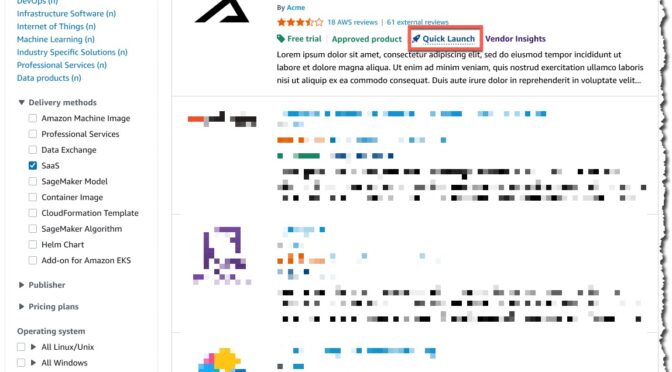
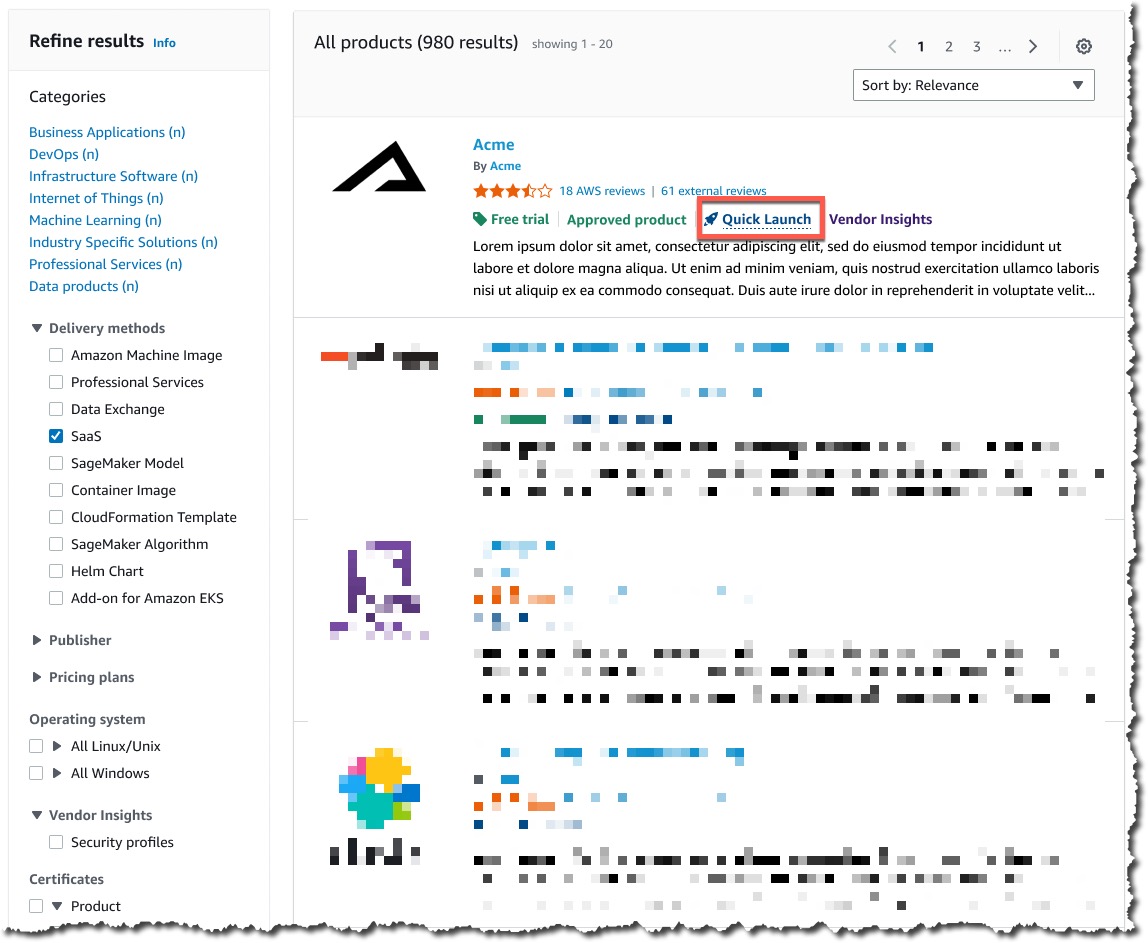
It’s easy to find which SaaS products have Quick Launch enabled when you are browsing in AWS Marketplace. Products that have this feature configured have a Quick Launch tag in their description.

Quick Launch tag in AWS Marketplace

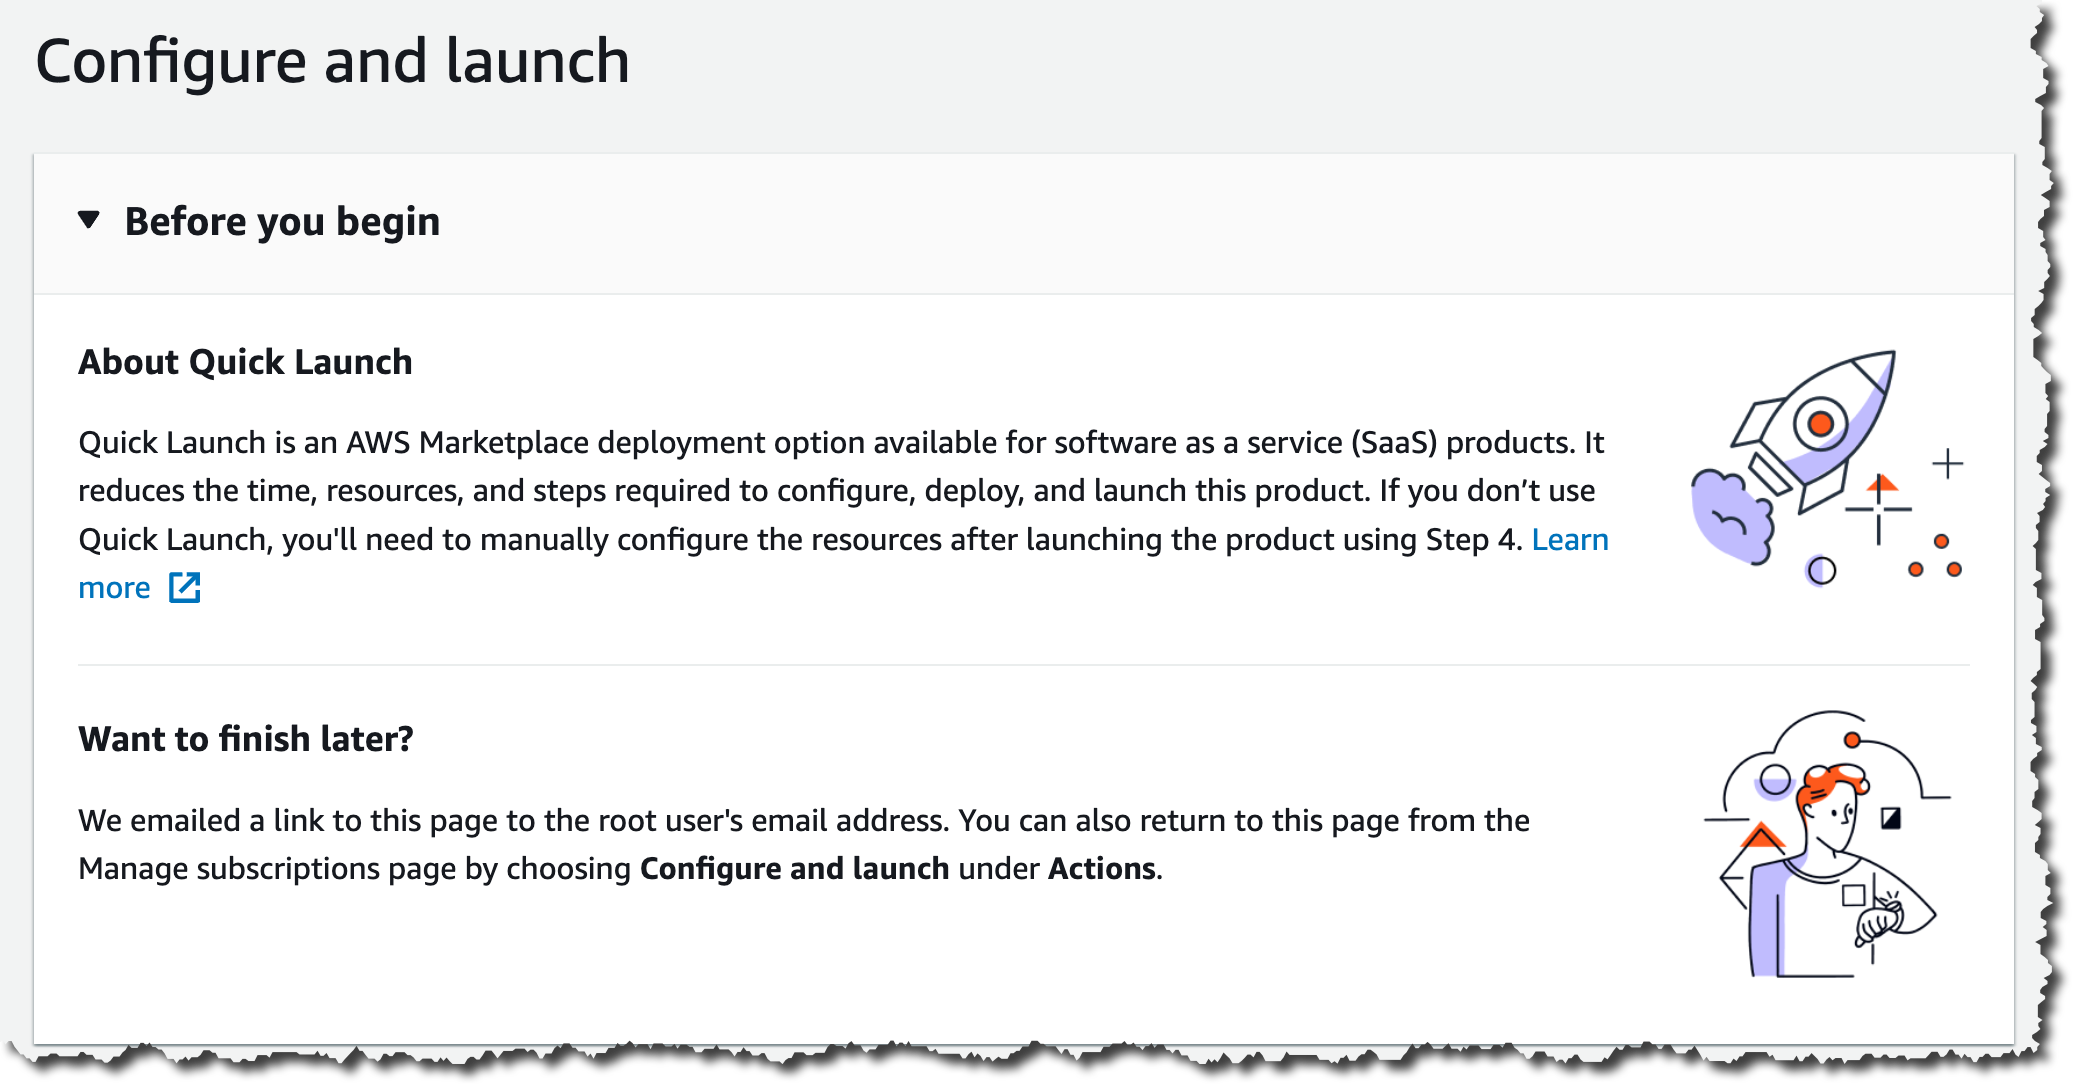
After completing the purchase process for a Quick Launch–enabled product, you will see a button to set up your account. That button will take you to the Configure and launch page, where you can complete the registration to set up your SaaS account, deploy any required AWS resources, and launch the SaaS product.

Step 1 - set permissions

The first step ensures that your account has the required AWS permissions to configure the software.

Step 1 - set permissions

The second step involves configuring the vendor account, either to sign in to an existing account or to create a new account on the vendor website. After signing in, the vendor site may pass essential keys and parameters that are needed in the next step to configure the integration.

Step 2 - Log into the vendor account

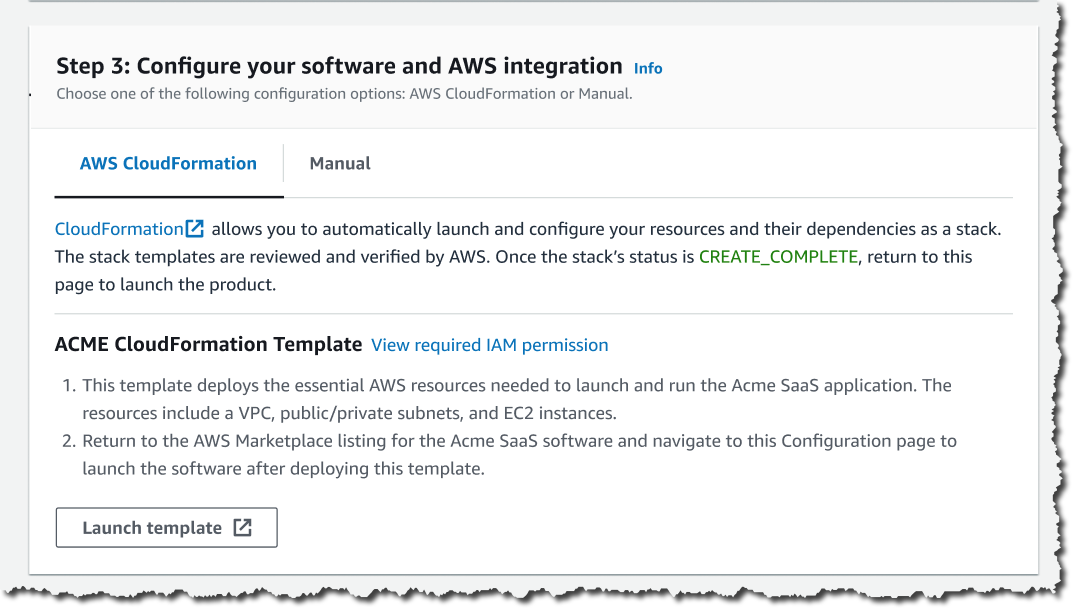
The third step allows you to configure the software and AWS integration. In this step, the vendor provides one or more CloudFormation templates that provision the required AWS resources to configure and use the product.

Step 3 - Configure your software and AWS integration

The final step is to launch the software once everything is configured.

Step 6 - Launch your software

Availability
Sellers can enable this feature in their SaaS product. If you are a seller and want to learn how to set this up in your product, check the Seller Guide for detailed instructions.

To learn more about SaaS in AWS Marketplace, visit the service page and view all the available SaaS products currently in AWS Marketplace.

Marcia

Package and deploy models faster with new tools and guided workflows in Amazon SageMaker

This post was originally published on this site

I’m happy to share that Amazon SageMaker now comes with an improved model deployment experience to help you deploy traditional machine learning (ML) models and foundation models (FMs) faster.

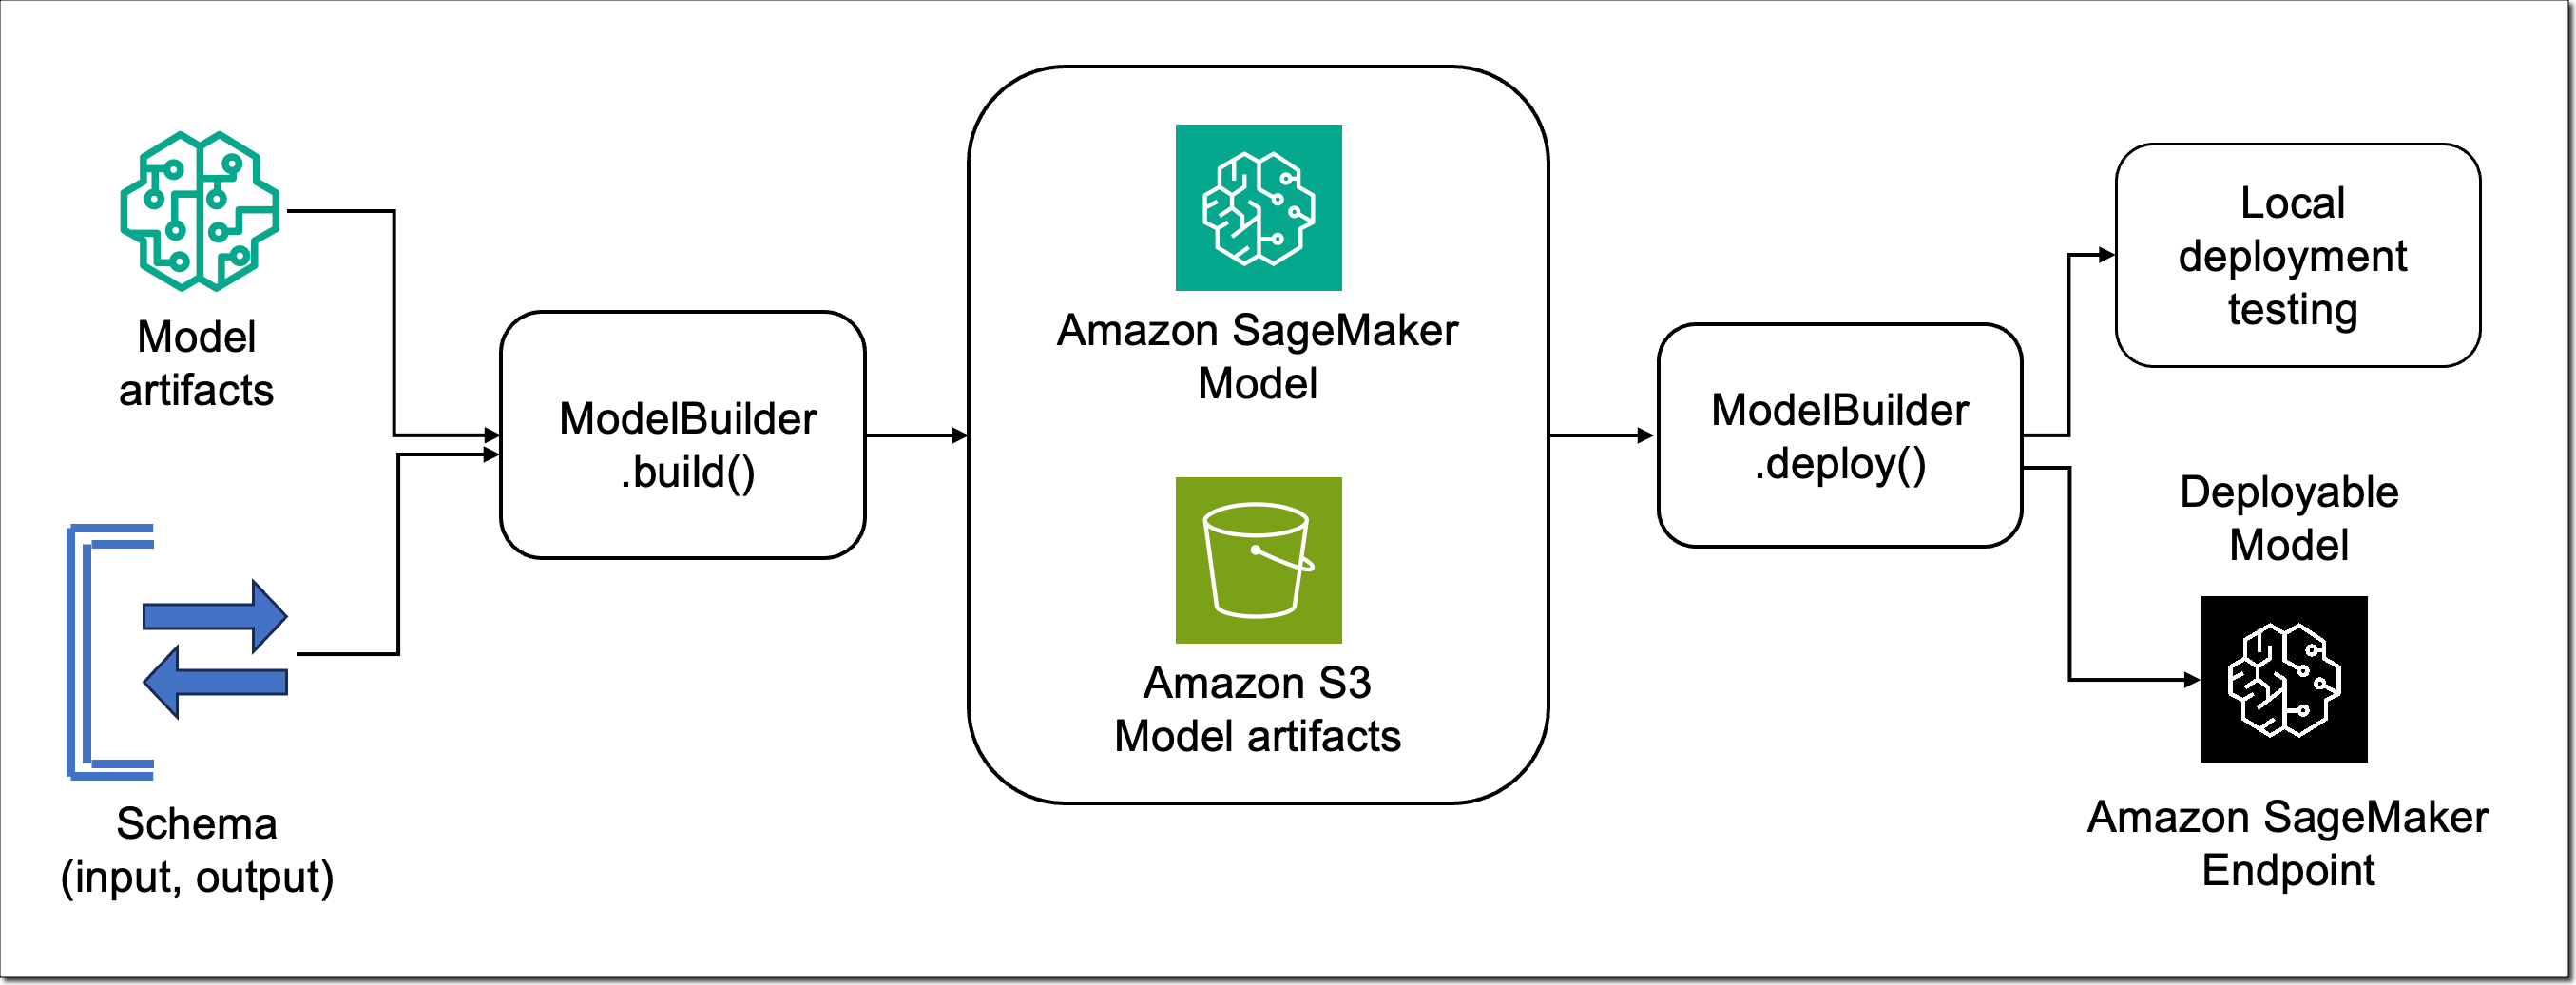
As a data scientist or ML practitioner, you can now use the new ModelBuilder class in the SageMaker Python SDK to package models, perform local inference to validate runtime errors, and deploy to SageMaker from your local IDE or SageMaker Studio notebooks.

In SageMaker Studio, new interactive model deployment workflows give you step-by-step guidance on which instance type to choose to find the most optimal endpoint configuration. SageMaker Studio also provides additional interfaces to add models, test inference, and enable auto scaling policies on the deployed endpoints.

New tools in SageMaker Python SDK
The SageMaker Python SDK has been updated with new tools, including ModelBuilder and SchemaBuilder classes that unify the experience of converting models into SageMaker deployable models across ML frameworks and model servers. Model builder automates the model deployment by selecting a compatible SageMaker container and capturing dependencies from your development environment. Schema builder helps to manage serialization and deserialization tasks of model inputs and outputs. You can use the tools to deploy the model in your local development environment to experiment with it, fix any runtime errors, and when ready, transition from local testing to deploy the model on SageMaker with a single line of code.

Amazon SageMaker ModelBuilder

Let me show you how this works. In the following example, I choose the Falcon-7B model from the Hugging Face model hub. I first deploy the model locally, run a sample inference, perform local benchmarking to find the optimal configuration, and finally deploy the model with the suggested configuration to SageMaker.

First, import the updated SageMaker Python SDK and define a sample model input and output that matches the prompt format for the selected model.

import sagemaker
from sagemaker.serve.builder.model_builder import ModelBuilder
from sagemaker.serve.builder.schema_builder import SchemaBuilder
from sagemaker.serve import Mode

prompt = "Falcons are"
response = "Falcons are small to medium-sized birds of prey related to hawks and eagles."

sample_input = {
    "inputs": prompt,
    "parameters": {"max_new_tokens": 32}
}

sample_output = [{"generated_text": response}]

Then, create a ModelBuilder instance with the Hugging Face model ID, a SchemaBuilder instance with the sample model input and output, define a local model path, and set the mode to LOCAL_CONTAINER to deploy the model locally. The schema builder generates the required functions for serializing and deserializing the model inputs and outputs.

model_builder = ModelBuilder(
    model="tiiuae/falcon-7b",
    schema_builder=SchemaBuilder(sample_input, sample_output),
    model_path="/path/to/falcon-7b",
    mode=Mode.LOCAL_CONTAINER,
	env_vars={"HF_TRUST_REMOTE_CODE": "True"}
)

Next, call build() to convert the PyTorch model into a SageMaker deployable model. The build function generates the required artifacts for the model server, including the inferency.py and serving.properties files.

local_mode_model = model_builder.build()

For FMs, such as Falcon, you can optionally run tune() in local container mode that performs local benchmarking to find the optimal model serving configuration. This includes the tensor parallel degree that specifies the number of GPUs to use if your environment has multiple GPUs available. Once ready, call deploy() to deploy the model in your local development environment.

tuned_model = local_mode_model.tune()
tuned_model.deploy()

Let’s test the model.

updated_sample_input = model_builder.schema_builder.sample_input
print(updated_sample_input)

{'inputs': 'Falcons are',
 'parameters': {'max_new_tokens': 32}}
 
local_tuned_predictor.predict(updated_sample_input)[0]["generated_text"]

In my demo, the model returns the following response:

a type of bird that are known for their sharp talons and powerful beaks. They are also known for their ability to fly at high speeds […]

When you’re ready to deploy the model on SageMaker, call deploy() again, set the mode to SAGEMAKLER_ENDPOINT, and provide an AWS Identity and Access Management (IAM) role with appropriate permissions.

sm_predictor = tuned_model.deploy(
    mode=Mode.SAGEMAKER_ENDPOINT, 
	role="arn:aws:iam::012345678910:role/role_name"
)

This starts deploying your model on a SageMaker endpoint. Once the endpoint is ready, you can run predictions.

new_input = {'inputs': 'Eagles are','parameters': {'max_new_tokens': 32}}
sm_predictor.predict(new_input)[0]["generated_text"])

New SageMaker Studio model deployment experience
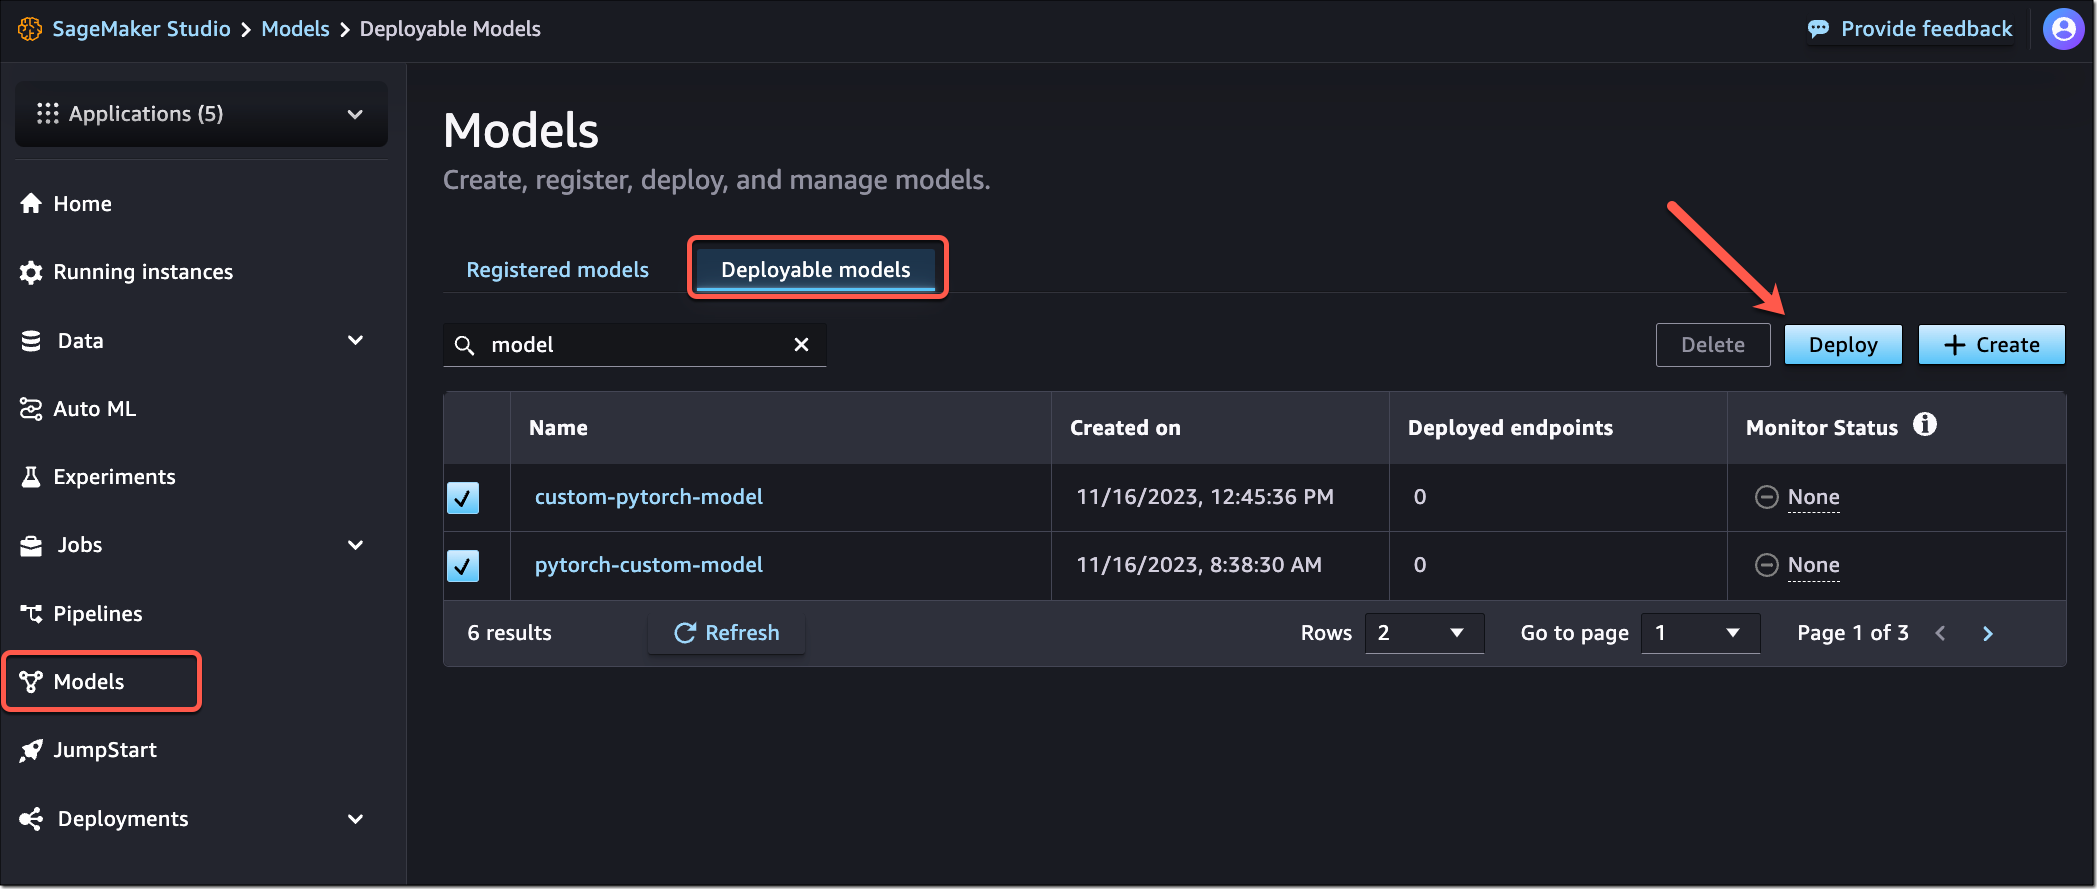
You can start the new interactive model deployment workflows by selecting one or more models to deploy from the models landing page or SageMaker JumpStart model details page or by creating a new endpoint from the endpoints details page.

Amazon SageMaker - New Model Deployment Experience

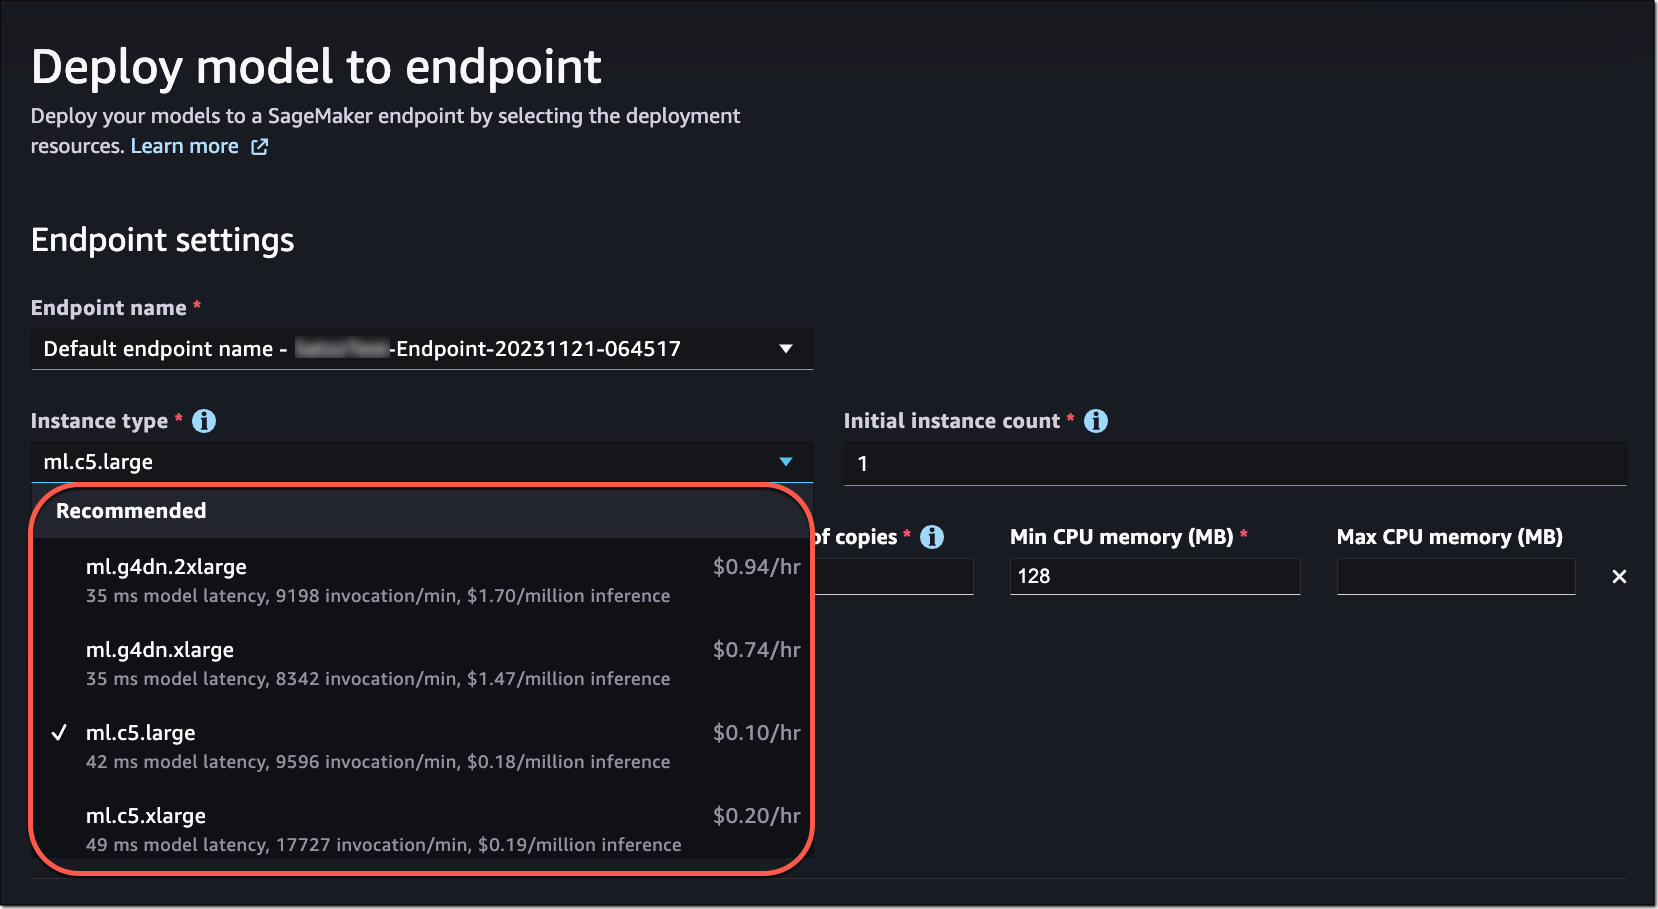
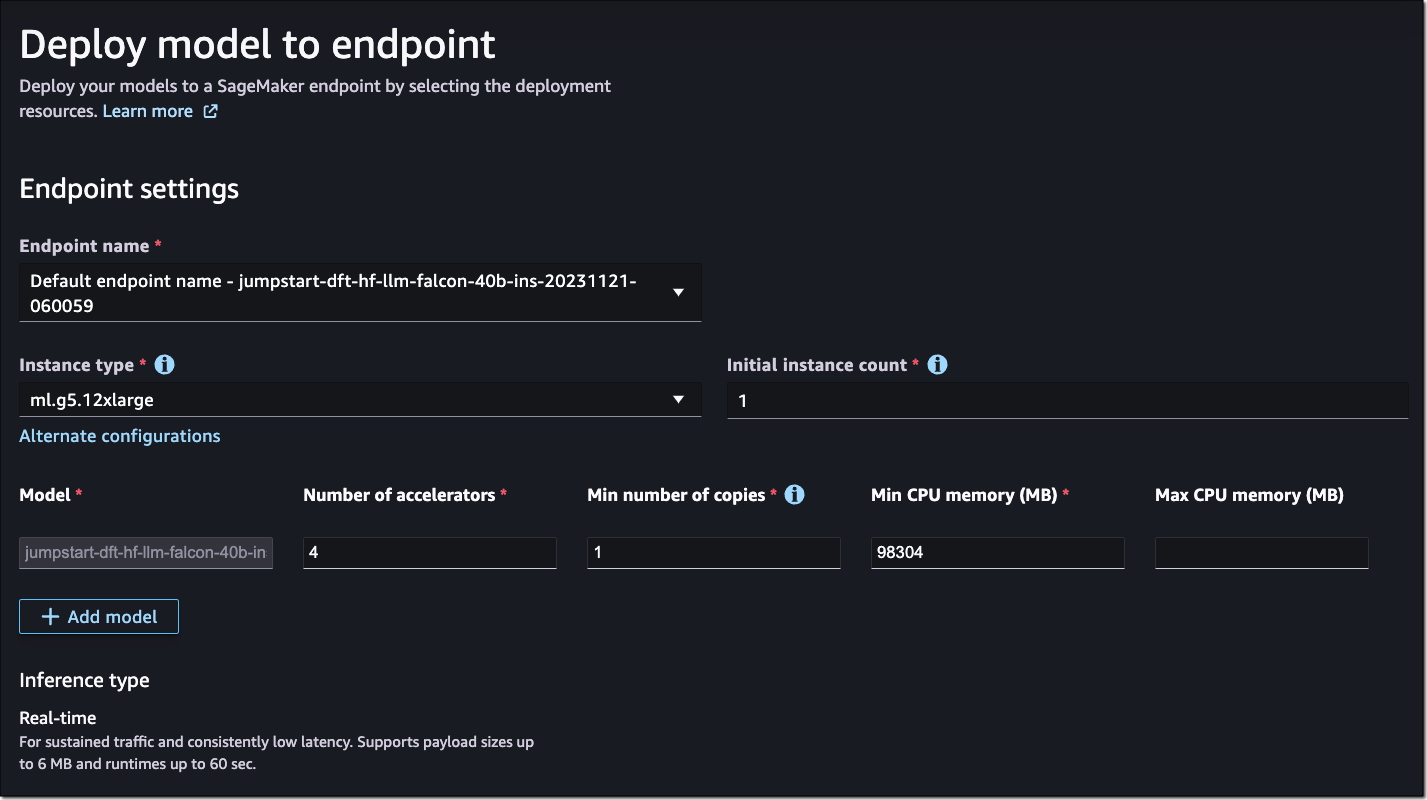
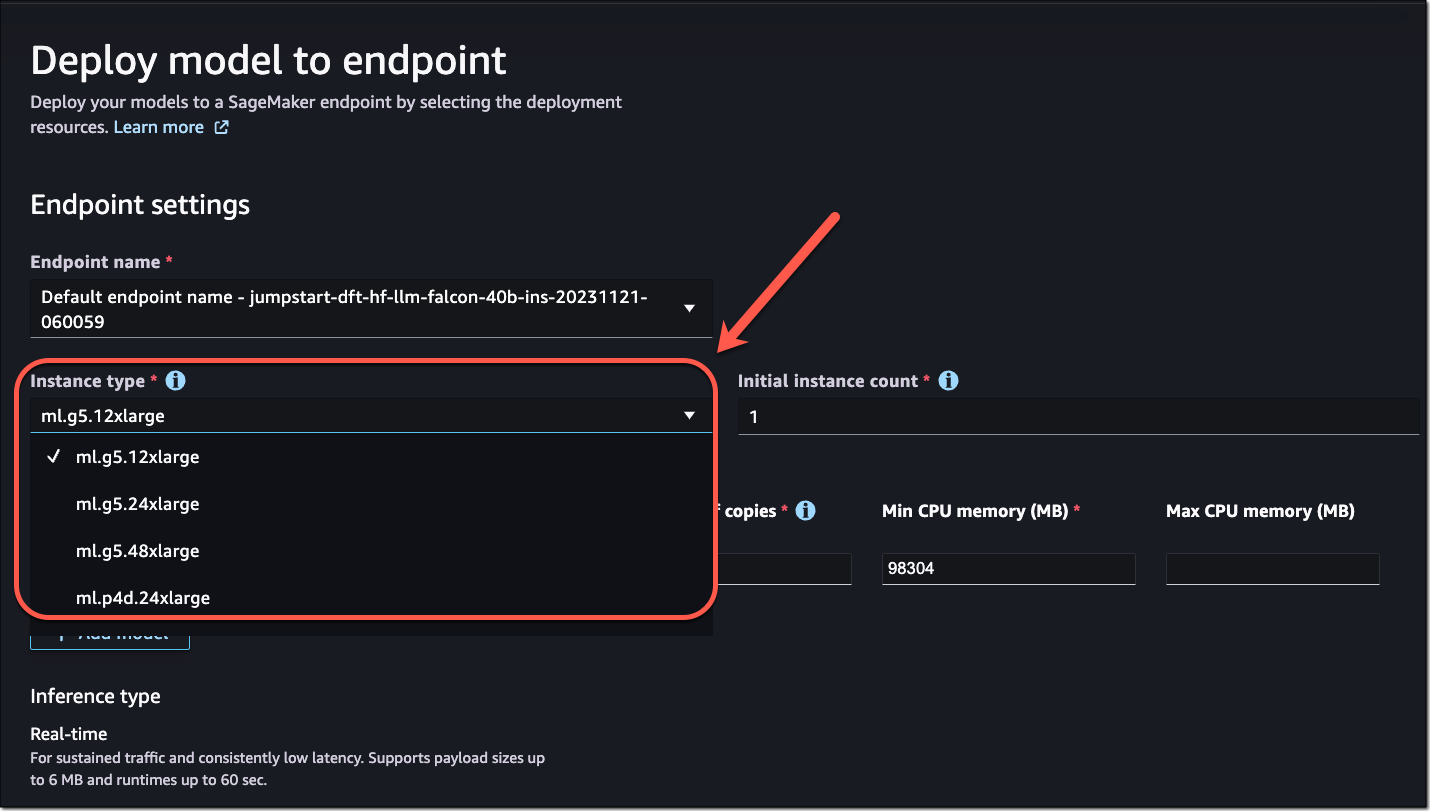
The new workflows help you quickly deploy the selected model(s) with minimal inputs. If you used SageMaker Inference Recommender to benchmark your model, the dropdown will show instance recommendations from that benchmarking.

Model deployment experience in SageMaker Studio

Without benchmarking your model, the dropdown will display prospective instances that SageMaker predicts could be a good fit based on its own heuristics. For some of the most popular SageMaker JumpStart models, you’ll see an AWS pretested optimal instance type. For other models, you’ll see generally recommended instance types. For example, if I select the Falcon 40B Instruct model in SageMaker JumpStart, I can see the recommended instance types.

Model deployment experience in SageMaker Studio

Model deployment experience in SageMaker Studio

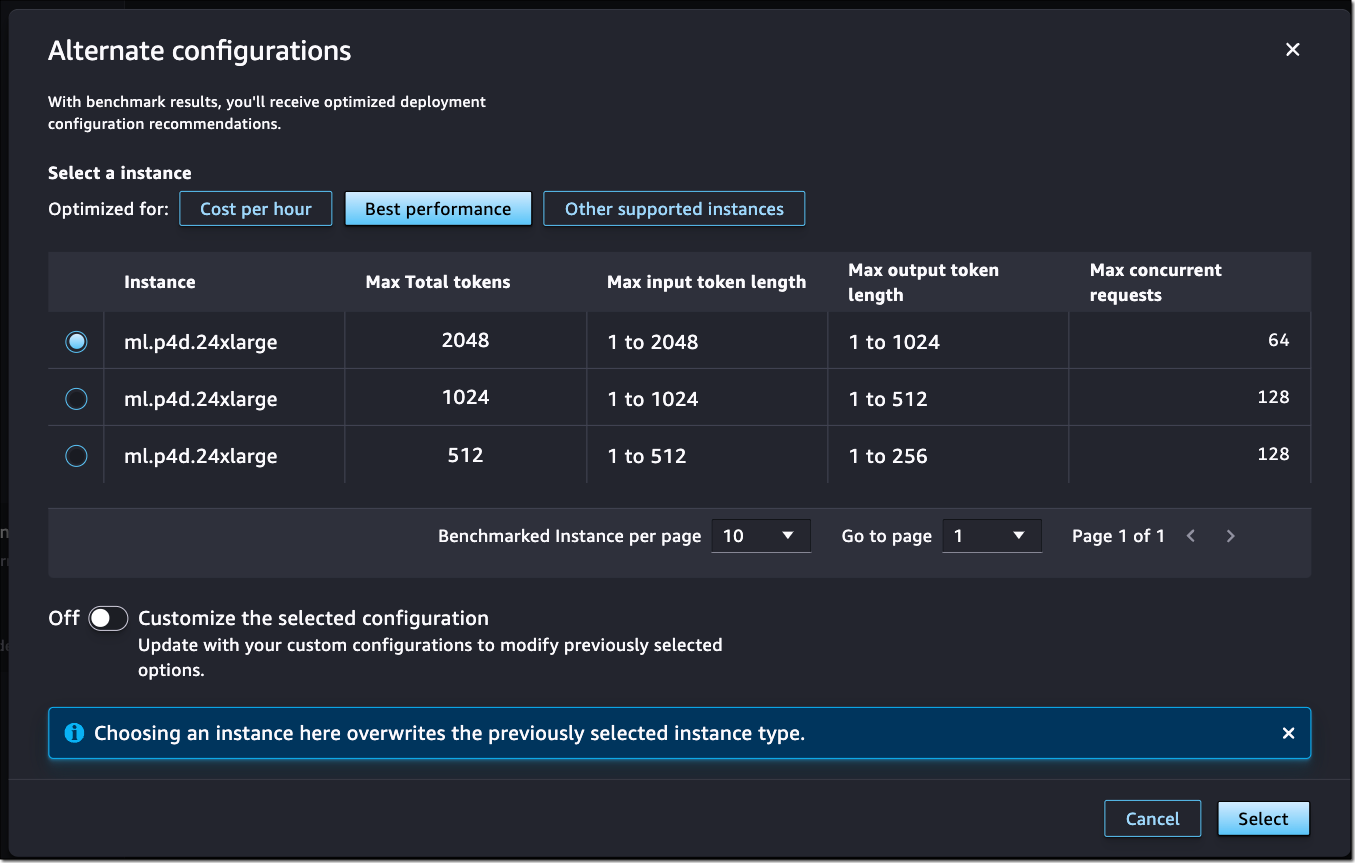
However, if I want to optimize the deployment for cost or performance to meet my specific use cases, I could open the Alternate configurations panel to view more options based on data from before benchmarking.

Model deployment experience in SageMaker Studio

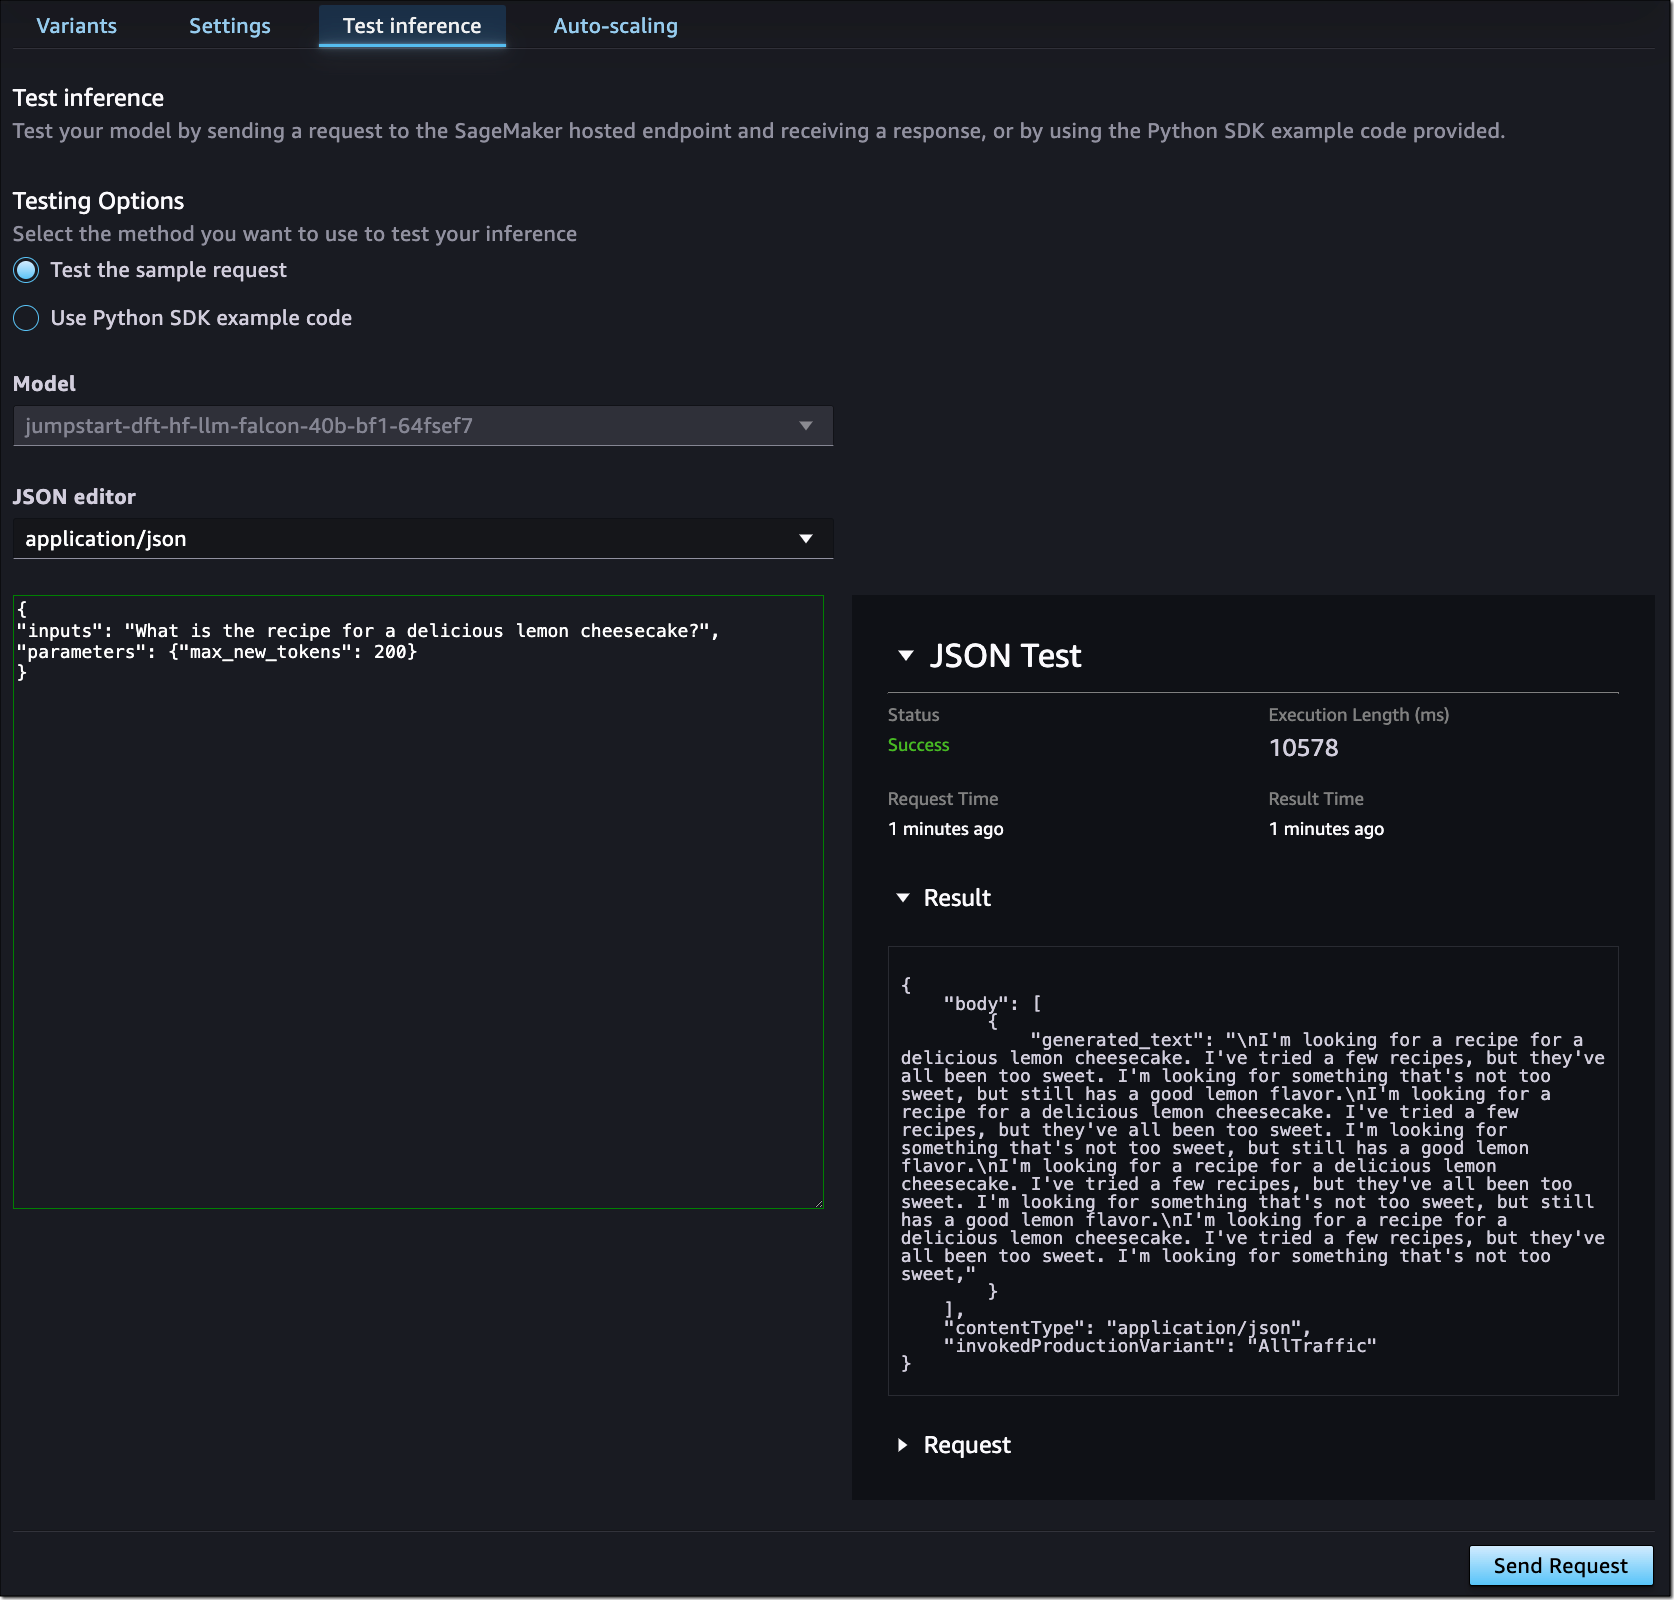
Once deployed, you can test inference or manage auto scaling policies.

Model deployment experience in SageMaker Studio

Things to know
Here are a couple of important things to know:

Supported ML models and frameworks – At launch, the new SageMaker Python SDK tools support model deployment for XGBoost and PyTorch models. You can deploy FMs by specifying the Hugging Face model ID or SageMaker JumpStart model ID using the SageMaker LMI container or Hugging Face TGI-based container. You can also bring your own container (BYOC) or deploy models using the Triton model server in ONNX format.

Now available
The new set of tools is available today in all AWS Regions where Amazon SageMaker real-time inference is available. There is no cost to use the new set of tools; you pay only for any underlying SageMaker resources that get created.

Learn more

Get started
Explore the new SageMaker model deployment experience in the AWS Management Console today!

— Antje

Use natural language to explore and prepare data with a new capability of Amazon SageMaker Canvas

This post was originally published on this site

Today, I’m happy to introduce the ability to use natural language instructions in Amazon SageMaker Canvas to explore, visualize, and transform data for machine learning (ML).

SageMaker Canvas now supports using foundation model- (FM) powered natural language instructions to complement its comprehensive data preparation capabilities for data exploration, analysis, visualization, and transformation. Using natural language instructions, you can now explore and transform your data to build highly accurate ML models. This new capability is powered by Amazon Bedrock.

Data is the foundation for effective machine learning, and transforming raw data to make it suitable for ML model building and generating predictions is key to better insights. Analyzing, transforming, and preparing data to build ML models is often the most time-consuming part of the ML workflow. With SageMaker Canvas, data preparation for ML is seamless and fast with 300+ built-in transforms, analyses, and an in-depth data quality insights report without writing any code. Starting today, the process of data exploration and preparation is faster and simpler in SageMaker Canvas using natural language instructions for exploring, visualizing, and transforming data.

Data preparation tasks are now accelerated through a natural language experience using queries and responses. You can quickly get started with contextual, guided prompts to understand and explore your data.

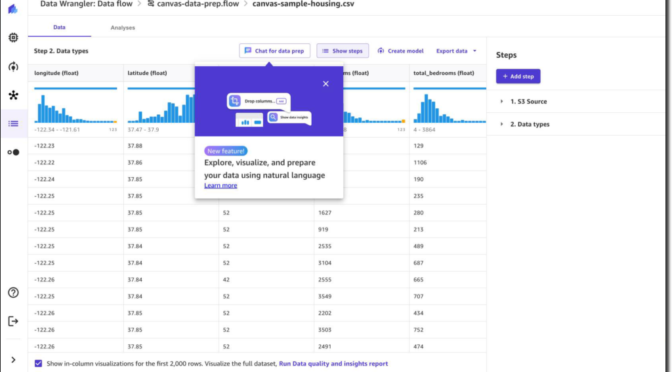
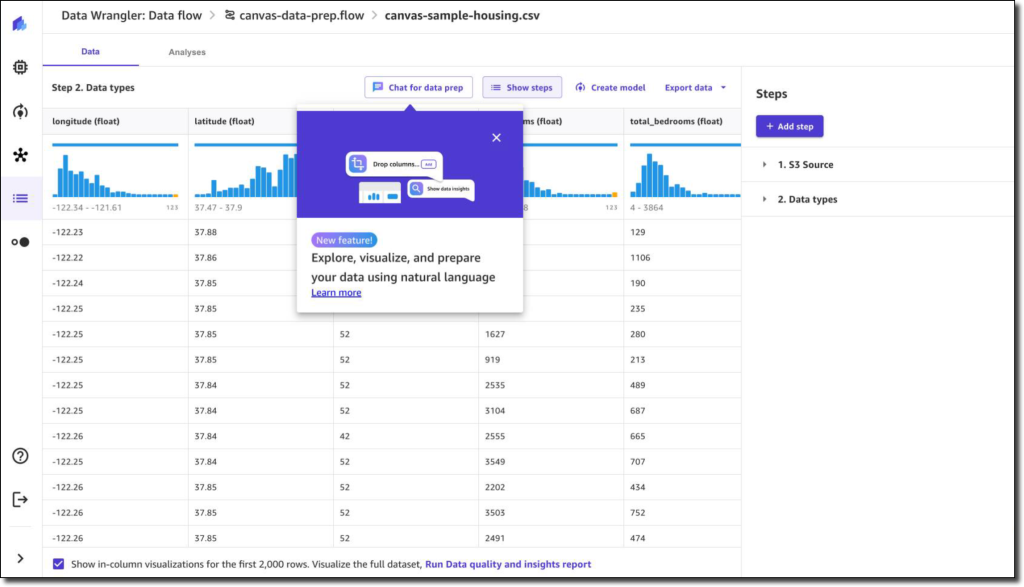
Say I want to build an ML model to predict house prices Using SageMaker Canvas. First, I need to prepare my housing dataset to build an accurate model. To get started with the new natural language instructions, I open the SageMaker Canvas application, and in the left navigation pane, I choose Data Wrangler. Under the Data tab and from the list of available datasets, I select the canvas-housing-sample.csv as the dataset, then select Create a data flow and choose Create. I see the tabular view of my dataset and an introduction to the new Chat for data prep capability.

data-flow

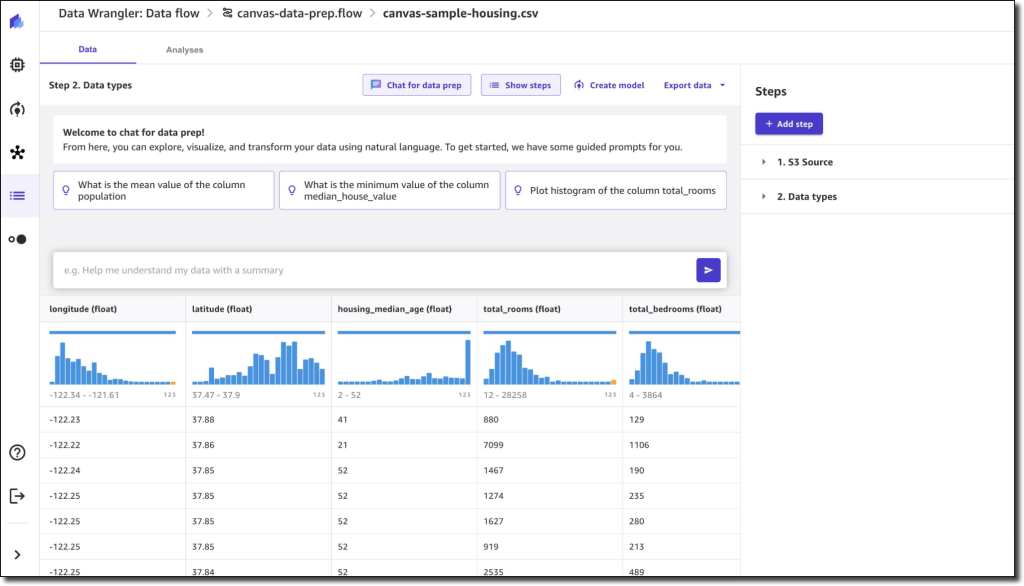
I select Chat for data prep, and it displays the chat interface with a set of guided prompts relevant to my dataset. I can use any of these prompts or query the data for something else.

chat-interface

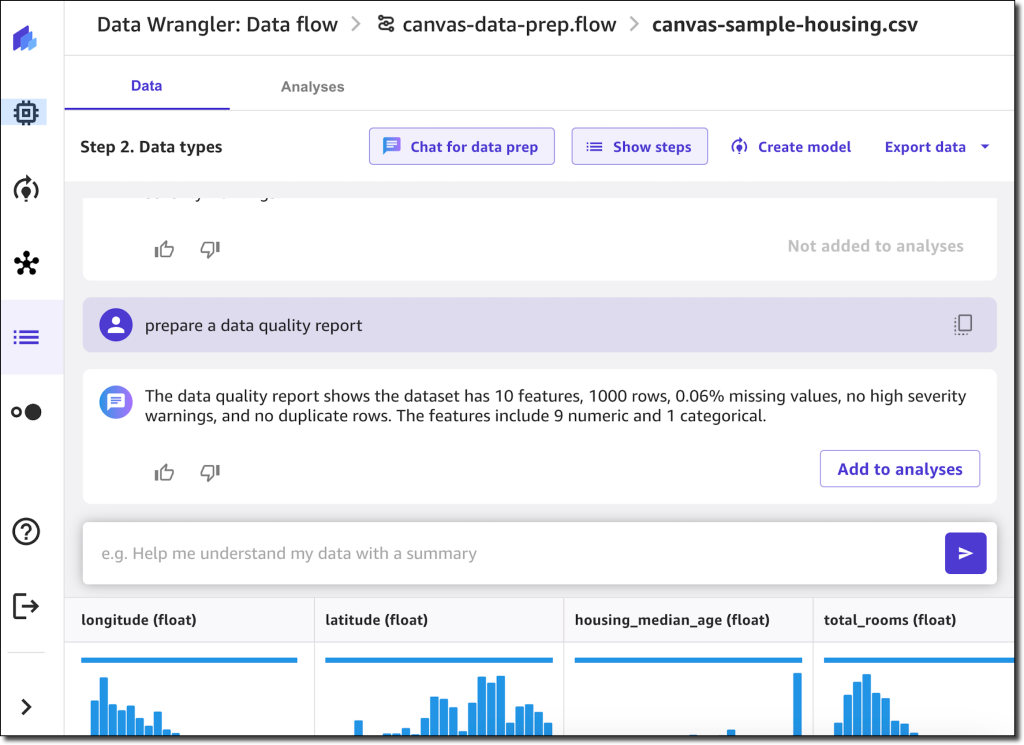
First, I want to understand the quality of my dataset to identify any outliers or anomalies. I ask SageMaker Canvas to generate a data quality report to accomplish this task.

data-quality

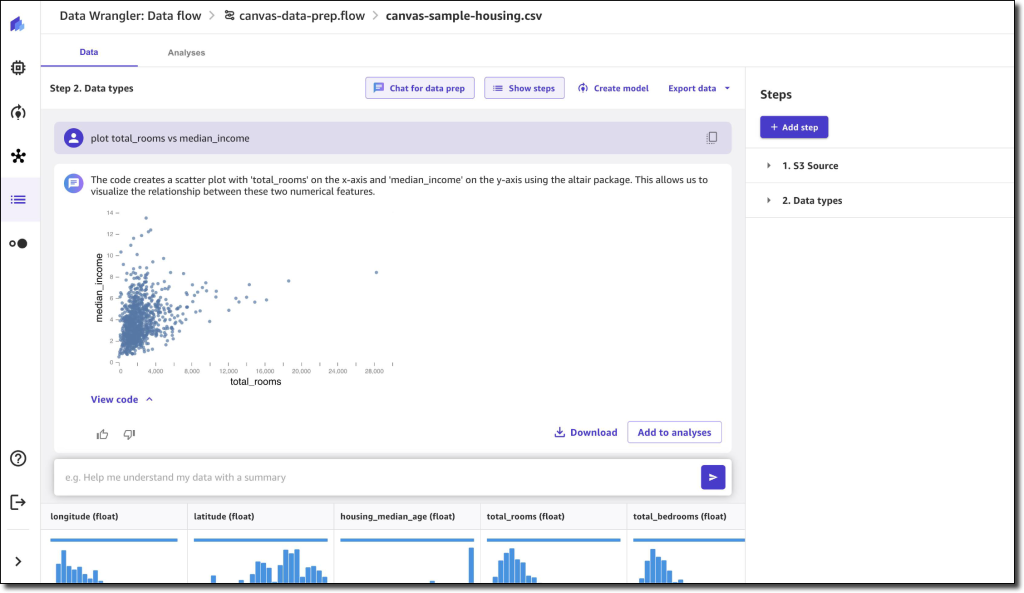
I see there are no major issues with my data. I would now like to visualize the distribution of a couple of features in the data. I ask SageMaker Canvas to plot a chart.

query

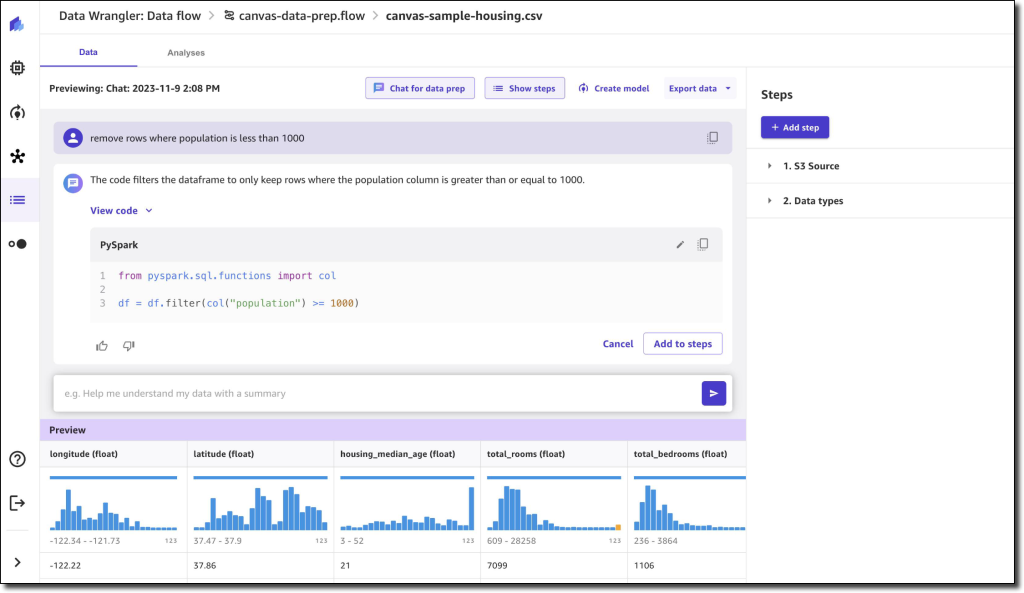
I now want to filter certain rows to transform my data. I ask SageMaker Canvas to remove rows where the population is less than 1,000. Canvas removes those rows, shows me a preview of the transformed data, and also gives me the option to view and update the code that generated the transform.

code-view

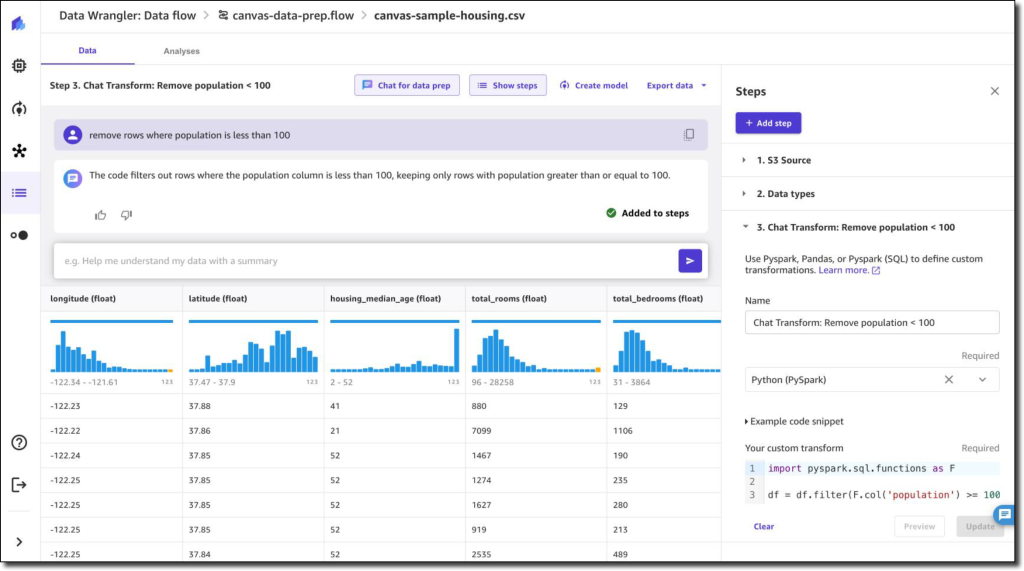
I am happy with the preview and add the transformed data to my list of data transform steps on the right. SageMaker Canvas adds the step along with the code.

transform

Now that my data is transformed, I can go on to build my ML model to predict house prices and even deploy the model into production using the same visual interface of SageMaker Canvas, without writing a single line of code.

Data preparation has never been easier for ML!

Availability
The new capability in Amazon SageMaker Canvas to explore and transform data using natural language queries is available in all AWS Regions where Amazon SageMaker Canvas and Amazon Bedrock are supported.

Learn more
Amazon SageMaker Canvas product page

Go build!

— Irshad

Amazon SageMaker adds new inference capabilities to help reduce foundation model deployment costs and latency

This post was originally published on this site

Today, we are announcing new Amazon SageMaker inference capabilities that can help you optimize deployment costs and reduce latency. With the new inference capabilities, you can deploy one or more foundation models (FMs) on the same SageMaker endpoint and control how many accelerators and how much memory is reserved for each FM. This helps to improve resource utilization, reduce model deployment costs on average by 50 percent, and lets you scale endpoints together with your use cases.

For each FM, you can define separate scaling policies to adapt to model usage patterns while further optimizing infrastructure costs. In addition, SageMaker actively monitors the instances that are processing inference requests and intelligently routes requests based on which instances are available, helping to achieve on average 20 percent lower inference latency.

Key components
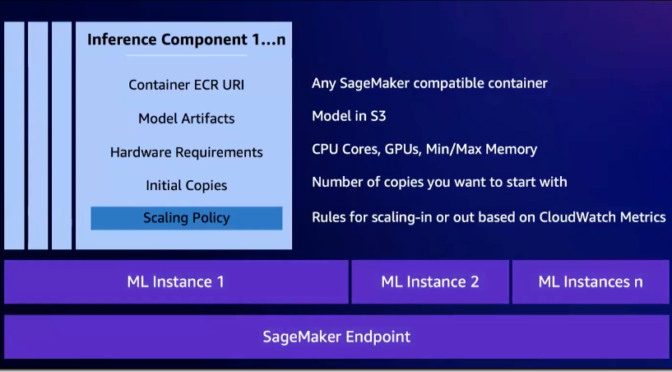
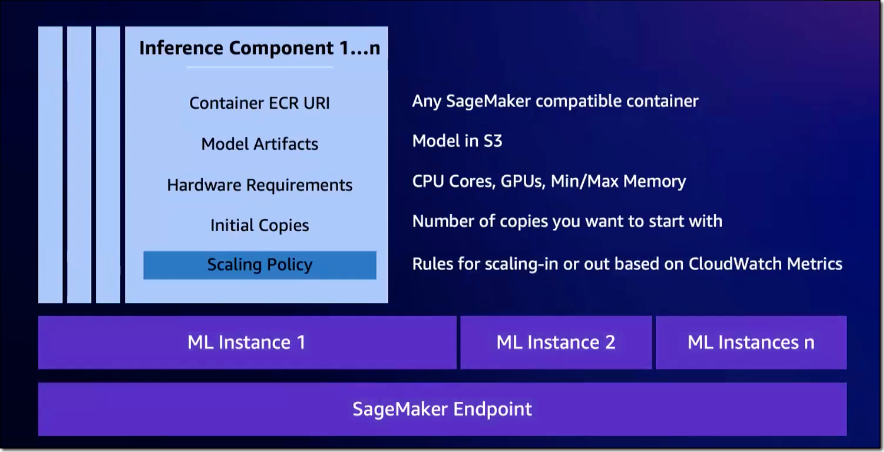
The new inference capabilities build upon SageMaker real-time inference endpoints. As before, you create the SageMaker endpoint with an endpoint configuration that defines the instance type and initial instance count for the endpoint. The model is configured in a new construct, an inference component. Here, you specify the number of accelerators and amount of memory you want to allocate to each copy of a model, together with the model artifacts, container image, and number of model copies to deploy.

Amazon SageMaker - MME

Let me show you how this works.

New inference capabilities in action
You can start using the new inference capabilities from SageMaker Studio, the SageMaker Python SDK, and the AWS SDKs and AWS Command Line Interface (AWS CLI). They are also supported by AWS CloudFormation.

For this demo, I use the AWS SDK for Python (Boto3) to deploy a copy of the Dolly v2 7B model and a copy of the FLAN-T5 XXL model from the Hugging Face model hub on a SageMaker real-time endpoint using the new inference capabilities.

Create a SageMaker endpoint configuration

import boto3
import sagemaker

role = sagemaker.get_execution_role()
sm_client = boto3.client(service_name="sagemaker")

sm_client.create_endpoint_config(
    EndpointConfigName=endpoint_config_name,
    ExecutionRoleArn=role,
    ProductionVariants=[{
        "VariantName": "AllTraffic",
        "InstanceType": "ml.g5.12xlarge",
        "InitialInstanceCount": 1,
		"RoutingConfig": {
            "RoutingStrategy": "LEAST_OUTSTANDING_REQUESTS"
        }
    }]
)

Create the SageMaker endpoint

sm_client.create_endpoint(
    EndpointName=endpoint_name,
    EndpointConfigName=endpoint_config_name,
)

Before you can create the inference component, you need to create a SageMaker-compatible model and specify a container image to use. For both models, I use the Hugging Face LLM Inference Container for Amazon SageMaker. These deep learning containers (DLCs) include the necessary components, libraries, and drivers to host large models on SageMaker.

Prepare the Dolly v2 model

from sagemaker.huggingface import get_huggingface_llm_image_uri

# Retrieve the container image URI
hf_inference_dlc = get_huggingface_llm_image_uri(
  "huggingface",
  version="0.9.3"
)

# Configure model container
dolly7b = {
    'Image': hf_inference_dlc,
    'Environment': {
        'HF_MODEL_ID':'databricks/dolly-v2-7b',
        'HF_TASK':'text-generation',
    }
}

# Create SageMaker Model
sagemaker_client.create_model(
    ModelName        = "dolly-v2-7b",
    ExecutionRoleArn = role,
    Containers       = [dolly7b]
)

Prepare the FLAN-T5 XXL model

# Configure model container
flant5xxlmodel = {
    'Image': hf_inference_dlc,
    'Environment': {
        'HF_MODEL_ID':'google/flan-t5-xxl',
        'HF_TASK':'text-generation',
    }
}

# Create SageMaker Model
sagemaker_client.create_model(
    ModelName        = "flan-t5-xxl",
    ExecutionRoleArn = role,
    Containers       = [flant5xxlmodel]
)

Now, you’re ready to create the inference component.

Create an inference component for each model
Specify an inference component for each model you want to deploy on the endpoint. Inference components let you specify the SageMaker-compatible model and the compute and memory resources you want to allocate. For CPU workloads, define the number of cores to allocate. For accelerator workloads, define the number of accelerators. RuntimeConfig defines the number of model copies you want to deploy.

# Inference compoonent for Dolly v2 7B
sm_client.create_inference_component(
    InferenceComponentName="IC-dolly-v2-7b",
    EndpointName=endpoint_name,
    VariantName=variant_name,
    Specification={
        "ModelName": "dolly-v2-7b",
        "ComputeResourceRequirements": {
		    "NumberOfAcceleratorDevicesRequired": 2, 
			"NumberOfCpuCoresRequired": 2, 
			"MinMemoryRequiredInMb": 1024
	    }
    },
    RuntimeConfig={"CopyCount": 1},
)

# Inference component for FLAN-T5 XXL
sm_client.create_inference_component(
    InferenceComponentName="IC-flan-t5-xxl",
    EndpointName=endpoint_name,
    VariantName=variant_name,
    Specification={
        "ModelName": "flan-t5-xxl",
        "ComputeResourceRequirements": {
		    "NumberOfAcceleratorDevicesRequired": 2, 
			"NumberOfCpuCoresRequired": 1, 
			"MinMemoryRequiredInMb": 1024
	    }
    },
    RuntimeConfig={"CopyCount": 1},
)

Once the inference components have successfully deployed, you can invoke the models.

Run inference
To invoke a model on the endpoint, specify the corresponding inference component.

import json
sm_runtime_client = boto3.client(service_name="sagemaker-runtime")
payload = {"inputs": "Why is California a great place to live?"}

response_dolly = sm_runtime_client.invoke_endpoint(
    EndpointName=endpoint_name,
    InferenceComponentName = "IC-dolly-v2-7b",
    ContentType="application/json",
    Accept="application/json",
    Body=json.dumps(payload),
)

response_flant5 = sm_runtime_client.invoke_endpoint(
    EndpointName=endpoint_name,
    InferenceComponentName = "IC-flan-t5-xxl",
    ContentType="application/json",
    Accept="application/json",
    Body=json.dumps(payload),
)

result_dolly = json.loads(response_dolly['Body'].read().decode())
result_flant5 = json.loads(response_flant5['Body'].read().decode())

Next, you can define separate scaling policies for each model by registering the scaling target and applying the scaling policy to the inference component. Check out the SageMaker Developer Guide for detailed instructions.

The new inference capabilities provide per-model CloudWatch metrics and CloudWatch Logs and can be used with any SageMaker-compatible container image across SageMaker CPU- and GPU-based compute instances. Given support by the container image, you can also use response streaming.

Now available
The new Amazon SageMaker inference capabilities are available today in AWS Regions US East (Ohio, N. Virginia), US West (Oregon), Asia Pacific (Jakarta, Mumbai, Seoul, Singapore, Sydney, Tokyo), Canada (Central), Europe (Frankfurt, Ireland, London, Stockholm), Middle East (UAE), and South America (São Paulo). For pricing details, visit Amazon SageMaker Pricing. To learn more, visit Amazon SageMaker.

Get started
Log in to the AWS Management Console and deploy your FMs using the new SageMaker inference capabilities today!

— Antje

Leverage foundation models for business analysis at scale with Amazon SageMaker Canvas

This post was originally published on this site

Today, I’m excited to introduce a new capability in Amazon SageMaker Canvas to use foundation models (FMs) from Amazon Bedrock and Amazon SageMaker Jumpstart through a no-code experience. This new capability makes it easier for you to evaluate and generate responses from FMs for your specific use case with high accuracy.

Every business has its own set of unique domain-specific vocabulary that generic models are not trained to understand or respond to. The new capability in Amazon SageMaker Canvas bridges this gap effectively. SageMaker Canvas trains the models for you so you don’t need to write any code using our company data so that the model output reflects your business domain and use case such as completing a marketing analysis. For the fine-tuning process, SageMaker Canvas creates a new custom model in your account, and the data used for fine-tuning is not used to train the original FM, ensuring the privacy of your data.

Earlier this year, we expanded support for ready-to-use models in Amazon SageMaker Canvas to include foundation models (FMs). This allows you to access, evaluate, and query FMs such as Claude 2, Amazon Titan, and Jurassic-2 (powered by Amazon Bedrock), as well as publicly available models such as Falcon and MPT (powered by Amazon SageMaker JumpStart) through a no-code interface. Extending this experience, we enabled the ability to query the FMs to generate insights from a set of documents in your own enterprise document index, such as Amazon Kendra. While it is valuable to query FMs, customers want to build FMs that generate responses and insights for their use cases. Starting today, a new capability to build FMs addresses this need to generate custom responses.

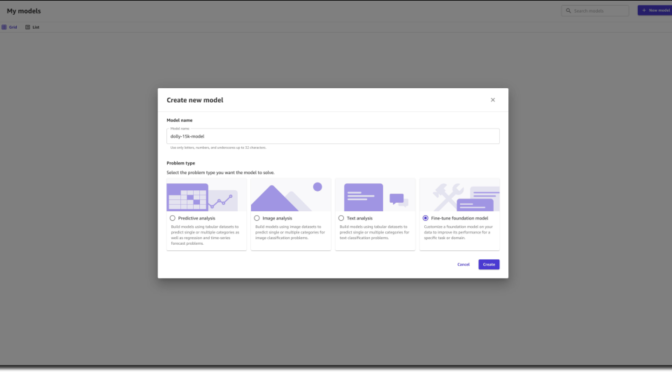
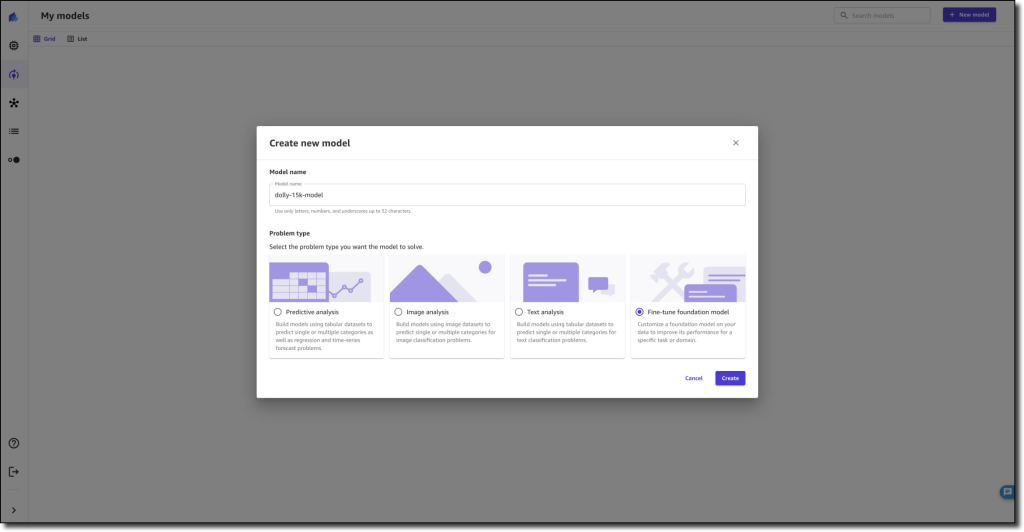
To get started, I open the SageMaker Canvas application and in the left navigation pane, I choose My models. I select the New model button, select Fine-tune foundation model, and select Create.

CreateModel

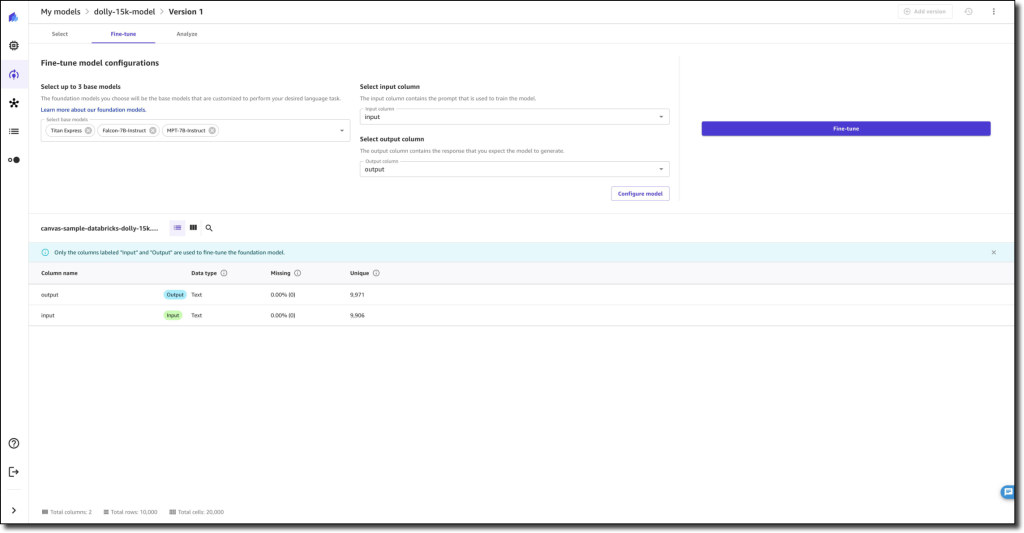
I select the training dataset and can choose up to three models to tune. I choose the input column with the prompt text and the output column with the desired output text. Then, I initiate the fine-tuning process by selecting Fine-tune.

ModelBuild

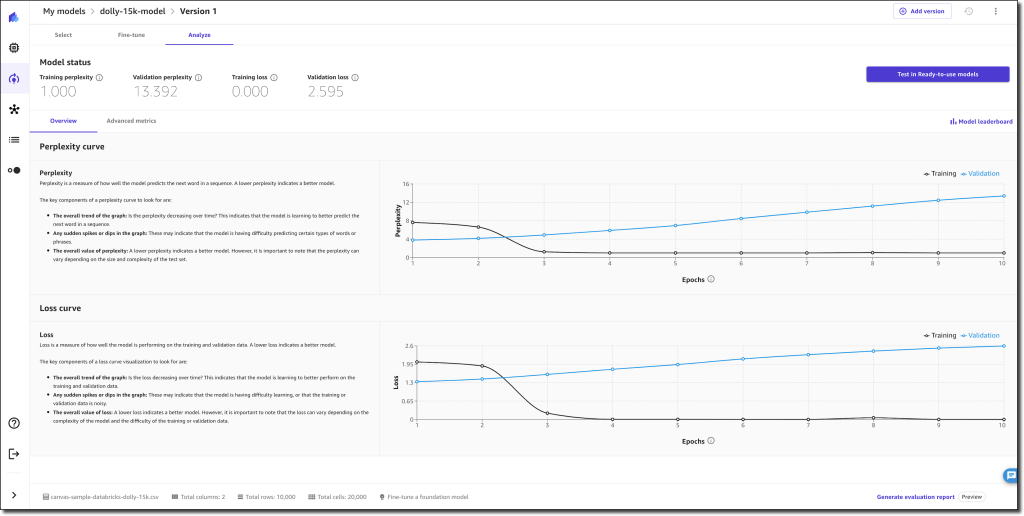
Once the fine-tuning process is completed, SageMaker Canvas gives me an analysis of the fine-tuned model with different metrics such as perplexity and loss curves, training loss, validation loss, and more. Additionally, SageMaker Canvas provides a model leaderboard that gives me the ability to measure and compare metrics around model quality for the generated models.

Analyze

Now, I am ready to test the model and compare responses with the original base model. To test, I select Test in Ready-to-use models from the Analyze page. The fine-tuned model is automatically deployed and is now available for me to chat and compare responses.

Compare

Now, I am ready to generate and evaluate insights specific to my use case. The icing on the cake was to achieve this without writing a single line of code.

Learn more

Go build!

— Irshad

PS: Writing a blog post at AWS is always a team effort, even when you see only one name under the post title. In this case, I want to thank Shyam Srinivasan for his technical assistance.

Introducing highly durable Amazon OpenSearch Service clusters with 30% price/performance improvement

This post was originally published on this site

You can use the new OR1 instances to create Amazon OpenSearch Service clusters that use Amazon Simple Storage Service (Amazon S3) for primary storage. You can ingest, store, index, and access just about any imaginable amount of data, while also enjoying a 30% price/performance improvement over existing instance types, eleven nines of data durability, and a zero-time Recovery Point Objective (RPO). You can use this to perform interactive log analytics, monitor application in real time, and more.

New OR1 Instances
These benefits are all made possible by the new OR1 instances, which are available in eight sizes and used for the data nodes of the cluster:

Instance Name vCPUs
Memory
EBS Storage Max (gp3)
or1.medium.search 1 8 GiB 400 GiB
or1.large.search 2 16 GiB 800 GiB
or1.xlarge.search 4 32 GiB 1.5 TiB
or1.2xlarge.search 8 64 GiB 3 TiB
or1.4xlarge.search 16 128 GiB 6 TiB
or1.8xlarge.search 32 256 GiB 12 TiB
or1.12xlarge.search 48 384 GiB 18 TiB
or1.16xlarge.search 64 512 GiB 24 TiB

To choose a suitable instance size, read Sizing Amazon OpenSearch Service domains.

The Amazon Elastic Block Store (Amazon EBS) volumes are used for primary storage, with data copied synchronously to S3 as it arrives. The data in S3 is used to create replicas and to rehydrate EBS after shards are moved between instances as a result of a node failure or a routine rebalancing operation. This is made possible by the remote-backed storage and segment replication features that were recently released for OpenSearch.

Creating a Domain
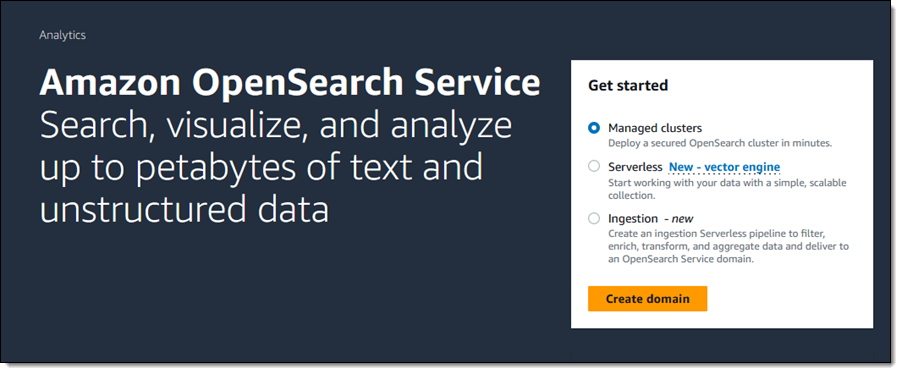
To create a domain I open the Amazon OpenSearch Service Console, select Managed clusters, and click Create domain:

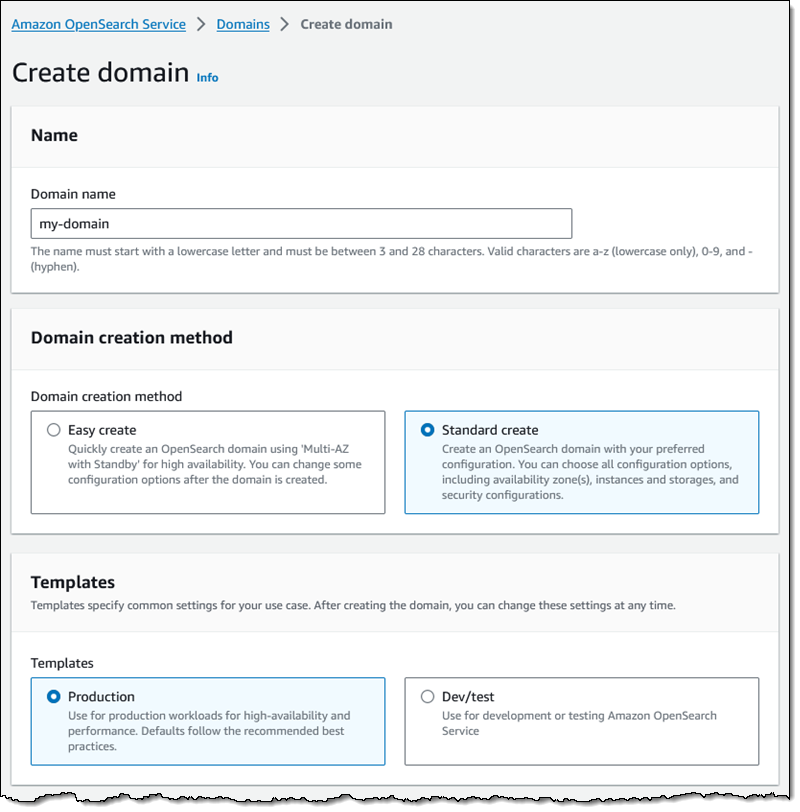
I enter a name for my domain (my-domain), select Standard create, and use the Production template:

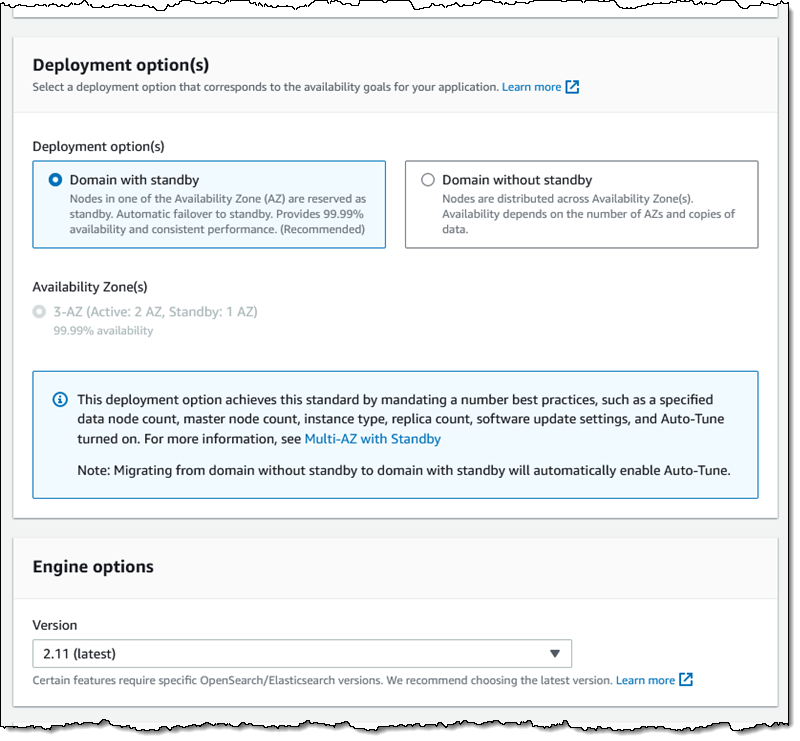
Then I choose the Domain with standby deployment option. This option will create active data nodes in two Availability Zones and a standby one in a third. I also choose the latest engine version:

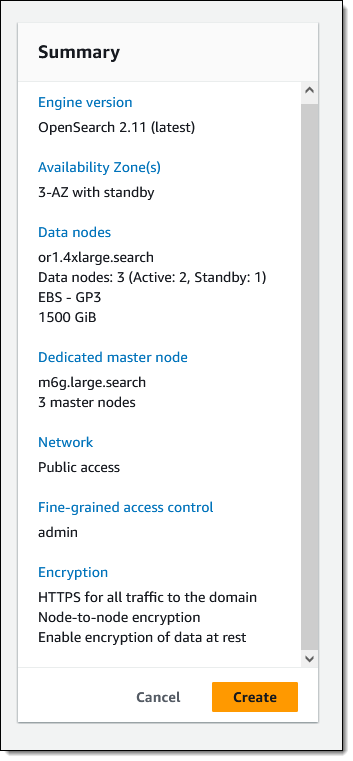
Then I select the OR1 instance family and (for my use case) configure 500 GiB of EBS storage per data node:

I set the other settings as needed, and click Create to proceed:

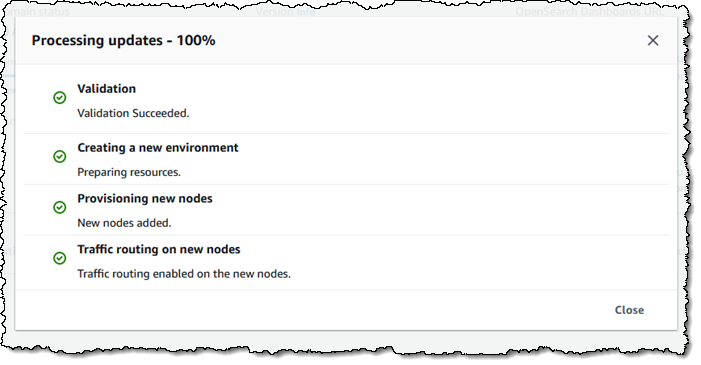
I take a quick lunch break and when i come back my domain is ready:

Things to Know
Here are a couple of things to know about this new storage option:

Engine Versions – Amazon OpenSearch Service engines version 2.11 and above support OR1 instances.

Regions – The OR1 instance family is available for use with OpenSearch in the US East (Ohio, N. Virginia), US West (N. California, Oregon), Asia Pacific (Mumbai, Singapore, Sydney, Tokyo), and Europe (Frankfurt, Ireland, Spain, Stockholm) AWS Regions.

Pricing – You pay On-Demand or Reserved prices for data nodes, and you also pay for EBS storage. See the Amazon OpenSearch Service Pricing page for more information.

Jeff;