Today, we’re announcing AWS Transform – continuous modernization (preview), a new capability of AWS Transform for continuous, autonomous tech debt analysis and remediation at scale. AWS Transform already helps enterprises migrate out of data centers, modernize mainframe and Windows applications, and handle the undifferentiated work of software maintenance: upgrading Java versions, swapping deprecated frameworks, and updating AWS Lambda runtimes before they reach end of life. This new experience builds on this. Customers get full visibility into the state of their codebase across thousands of repositories, prioritized findings, and the pull requests that make the fixes.
Engineering organizations typically consume up to 30% of IT budgets. Customers stitch together point tools: one to detect dependency issues, another to flag vulnerabilities, another for code quality. But no existing tool detects, prioritizes, and remediates tech debt continuously and at scale. The result is a manual, app-by-app cycle that drains engineering capacity. Leaders fall back on self-reported team status that lags reality and hides regressions. AI-assisted development makes this worse: as coding agents accelerate the pace of change, tech debt accumulates faster than developers can keep up. Customers need a capability that detects, prioritizes, and remediates tech debt continuously, autonomously, and at scale.
Continuous analysis
To address the visibility challenge, this new capability within AWS Transform automatically scans your code repositories against configurable baselines and generates findings in hours, not weeks. Out of the box, AWS Transform – continuous modernization includes policies for detecting end of life dependencies, deprecated frameworks, and other common sources of technical debt. You can also extend these with your own remediation patterns specific to your organization, including approved libraries, internal coding standards, or tech debt policies your platform team already enforces. For example, if your team has deprecated an internal library or prefers a particular logging pattern, you can codify that as a policy and run it across all your repositories continuously.
Unlike periodic manual efforts, continuous analysis provides ground truth directly from your code. When a repository falls behind your baseline, you know immediately, showing which components are behind and by how much, regardless of how the team chooses to address it. This eliminates the need for status check-ins and manual compliance tracking, giving platform teams an always current view of their technical debt landscape.
Autonomous remediation at scale
Once you’ve identified and prioritized findings, you can configure autonomous remediations that generate pull requests for affected repositories automatically. This new AWS Transform capability provides out-of-the-box remediation transformations for common scenarios such as Java version upgrades, SDK migrations, and library updates. You can also create custom transformations for organization-specific patterns.
When you launch a remediation, the continuous modernization capability creates pull requests for each affected repository, notifying the owning team with a message like: “This repository is behind on your organization’s baseline for this dependency. Here’s a PR that resolves it.” Teams can review and merge the PR, or choose to remediate using their own approach. Either way, continuous analysis detects when the fix is in place, providing ground truth without requiring manual confirmation.
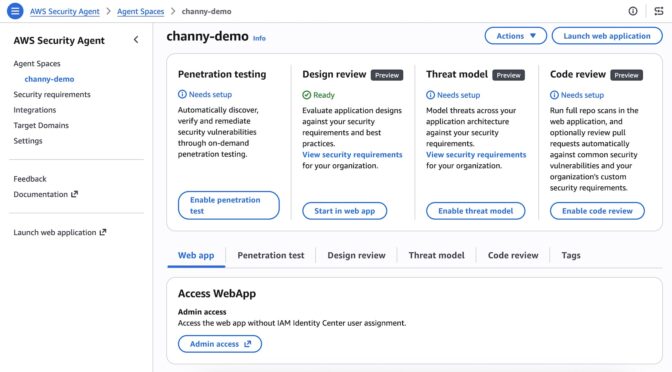
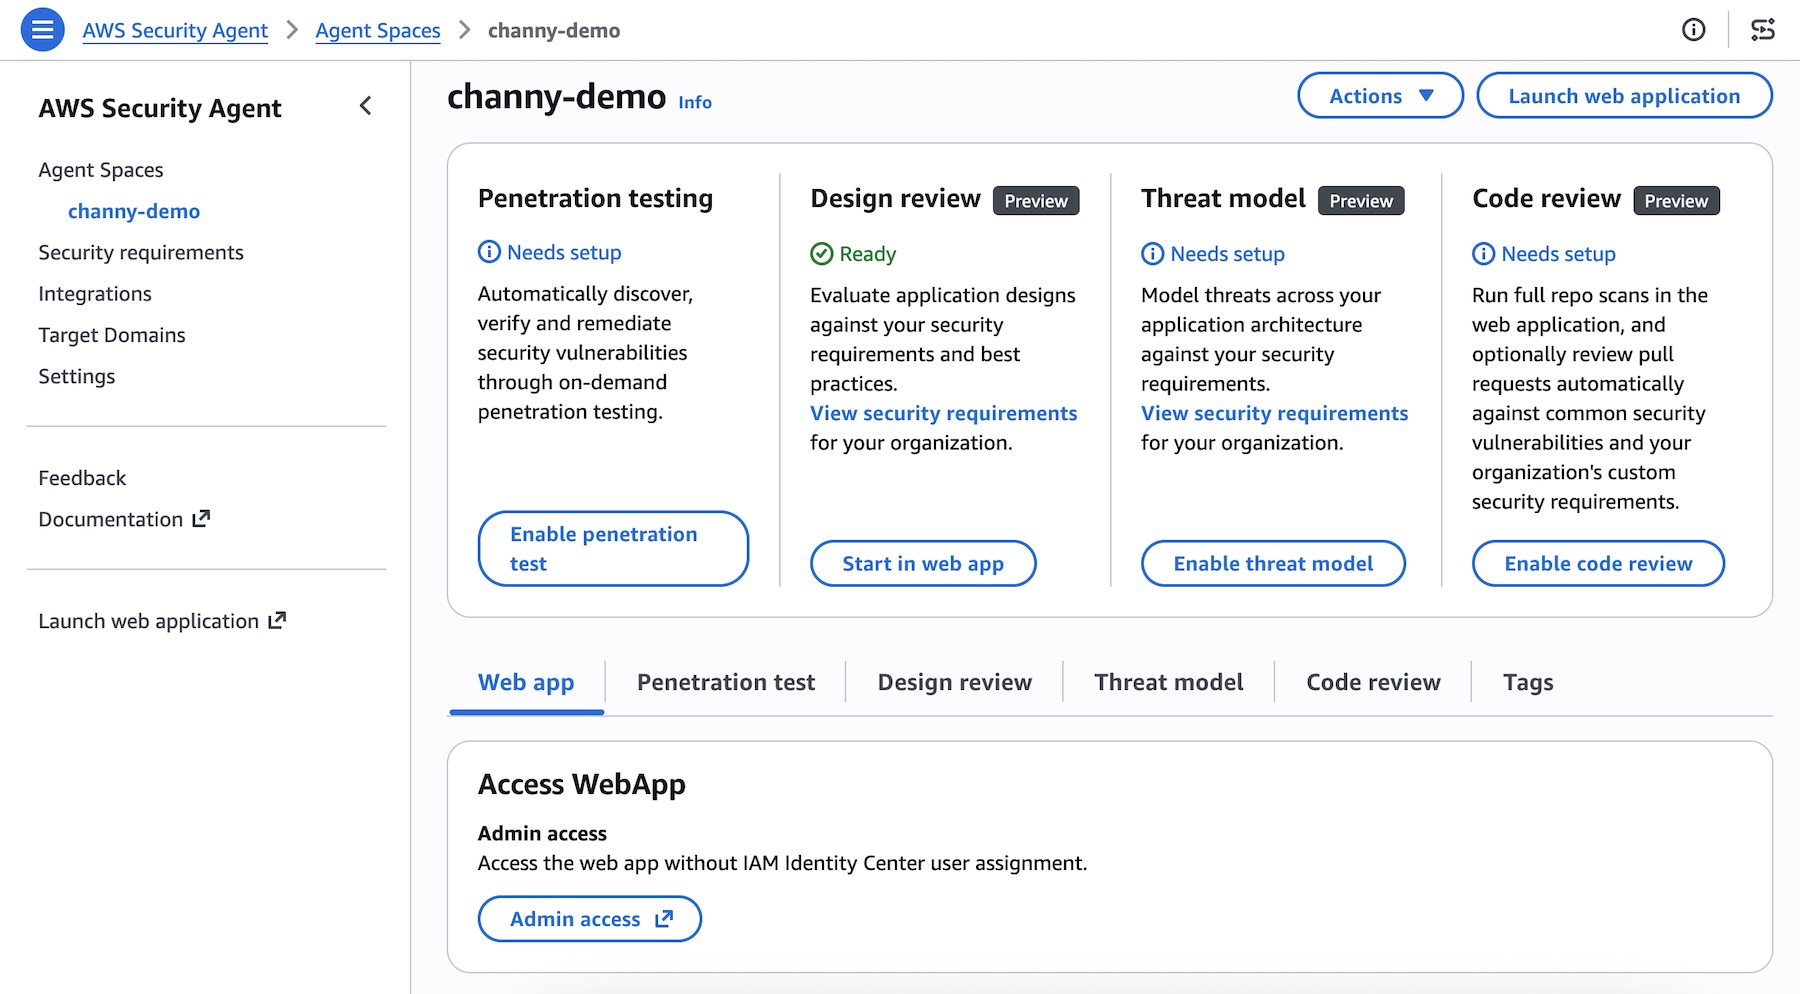
AWS Transform – continuous modernization integrates with AWS Security Agent to detect and remediate security vulnerabilities at the source-code level, so security findings flow into the same prioritized list and pull-request workflow as other tech debt.
Let’s try it out
To get started with, I navigated to the AWS Transform web application. From the dashboard, I can see an overview of my organization’s repositories and their current status against my configured baselines.
First, I connected my source control system and initiated an analysis against my specified policies. Within hours, the analysis returned findings across my repositories, showing which ones were behind the baseline and by how much. I could see the severity, the number of affected files, and the specific tech debt patterns detected.
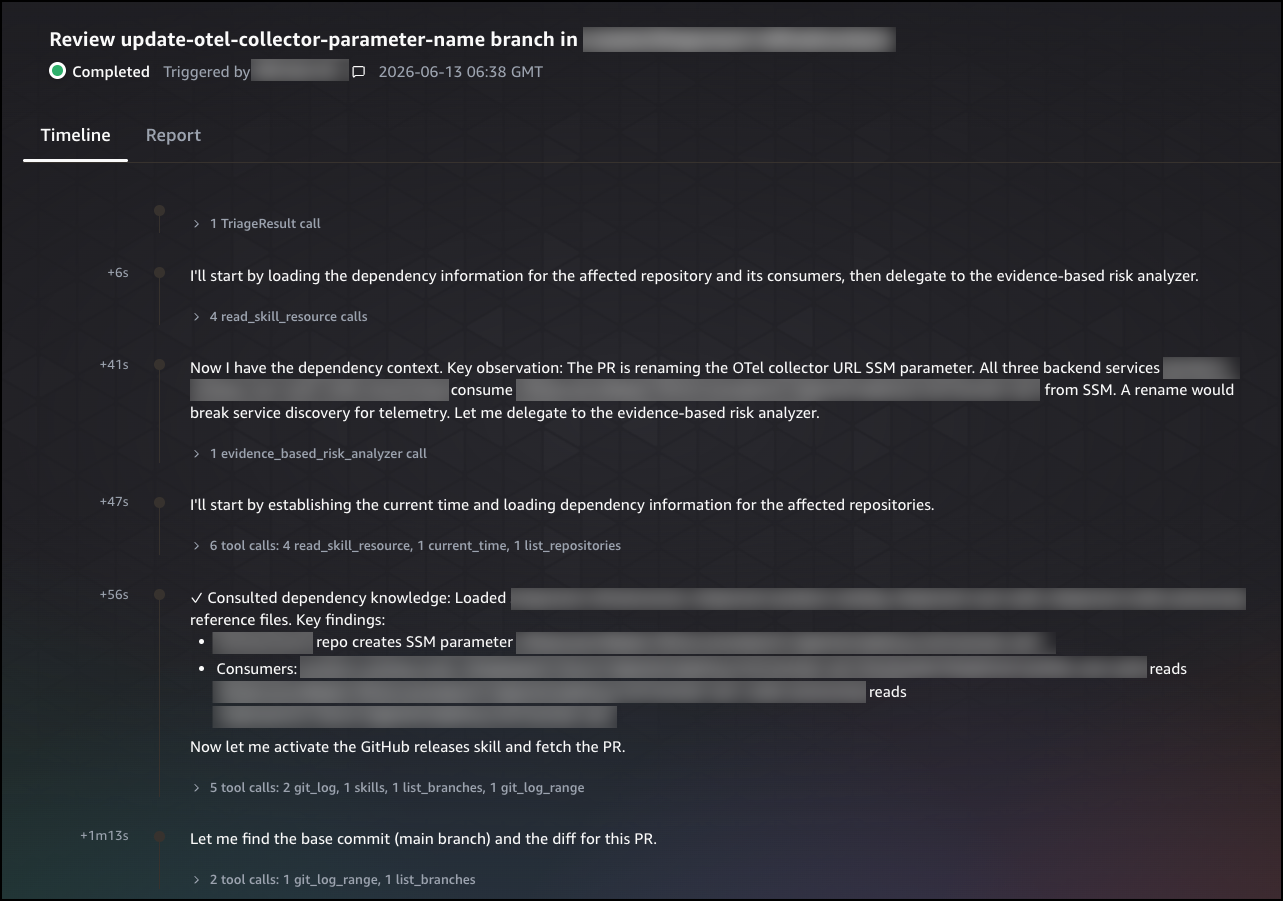
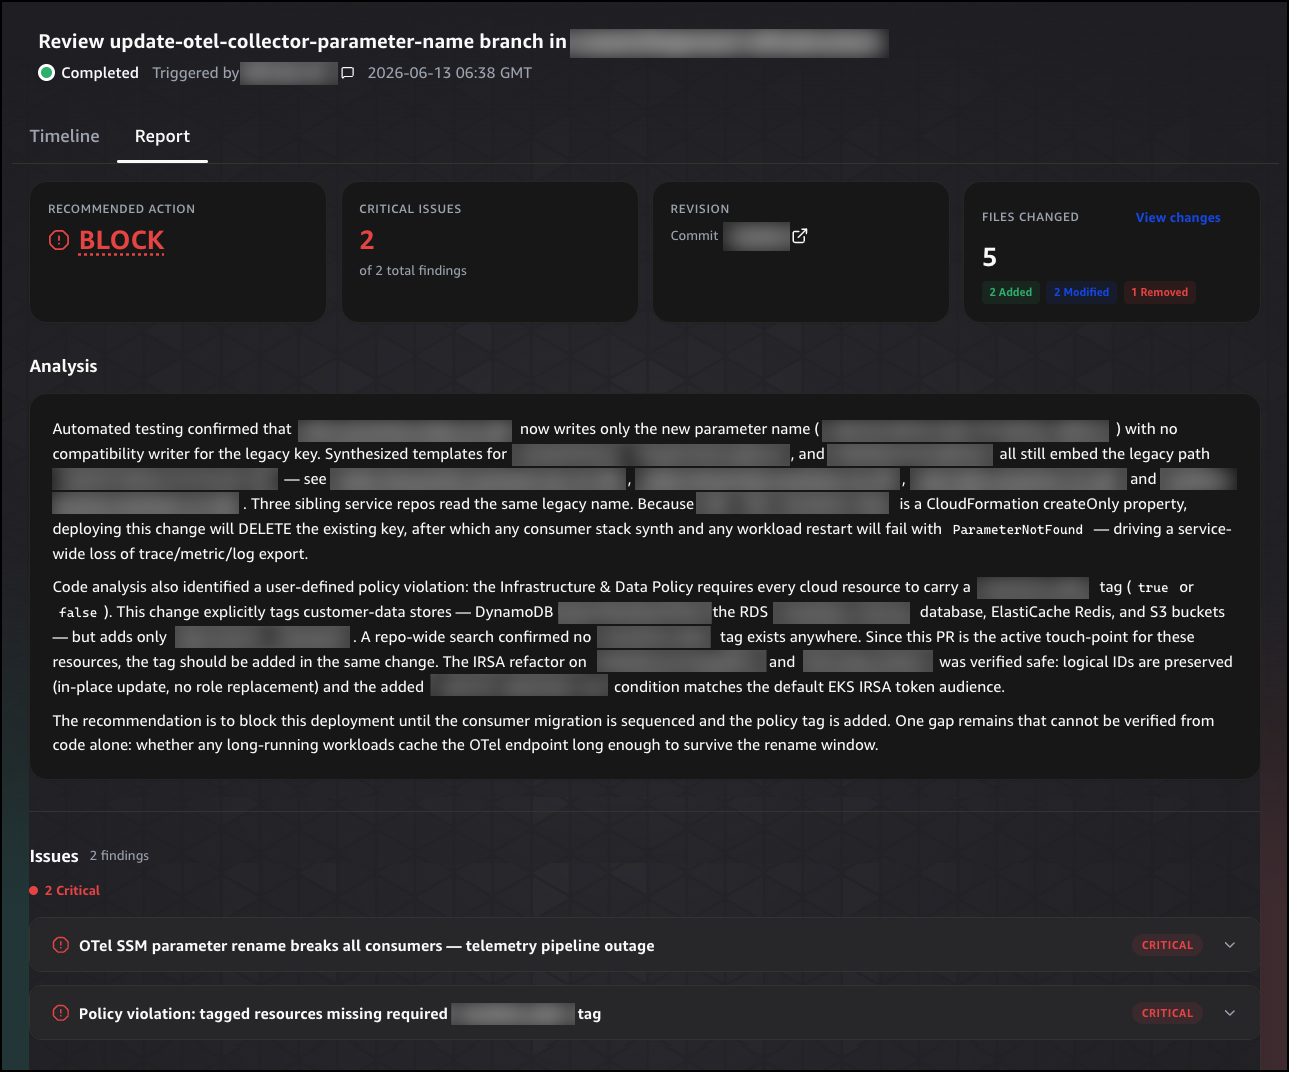
From here, I selected a group of high-priority findings and launched a remediation campaign. AWS Transform – continuous modernization generated pull requests for each affected repository. I could monitor the campaign’s progress in real time, seeing which PRs were created, which were merged, and which repositories returned to compliance.
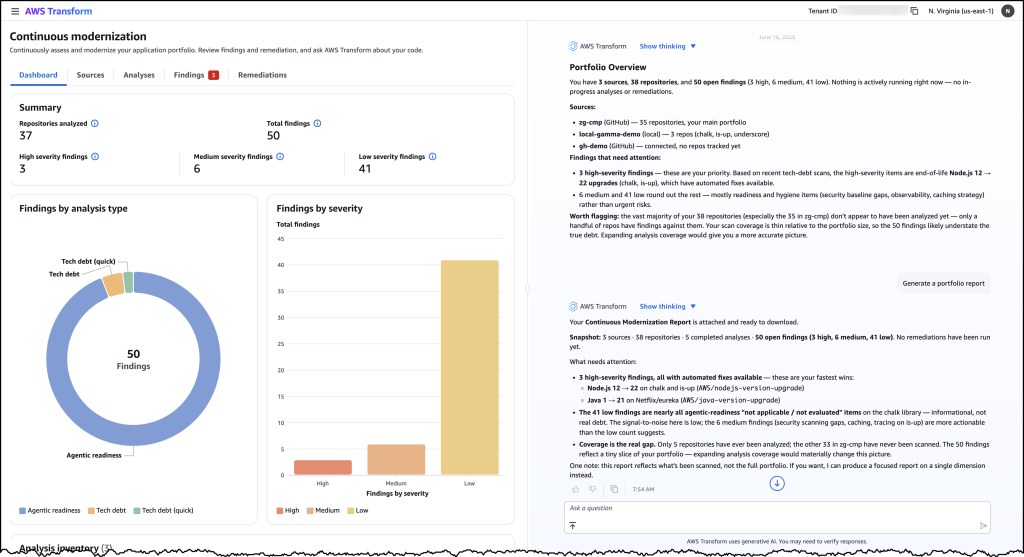
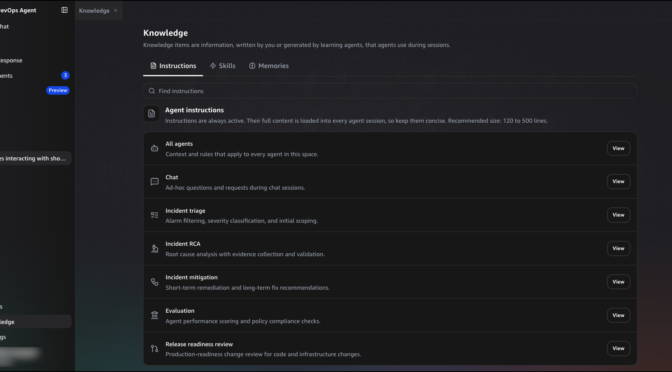
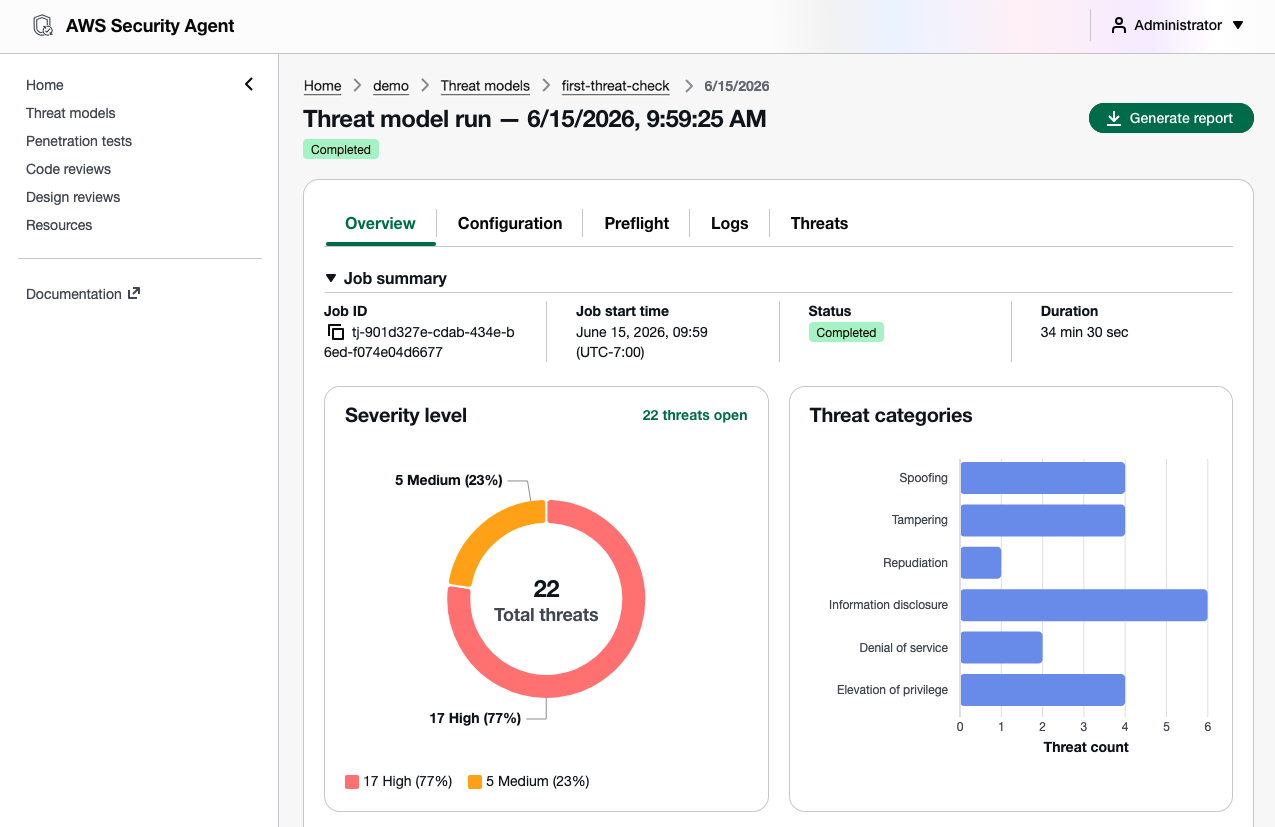
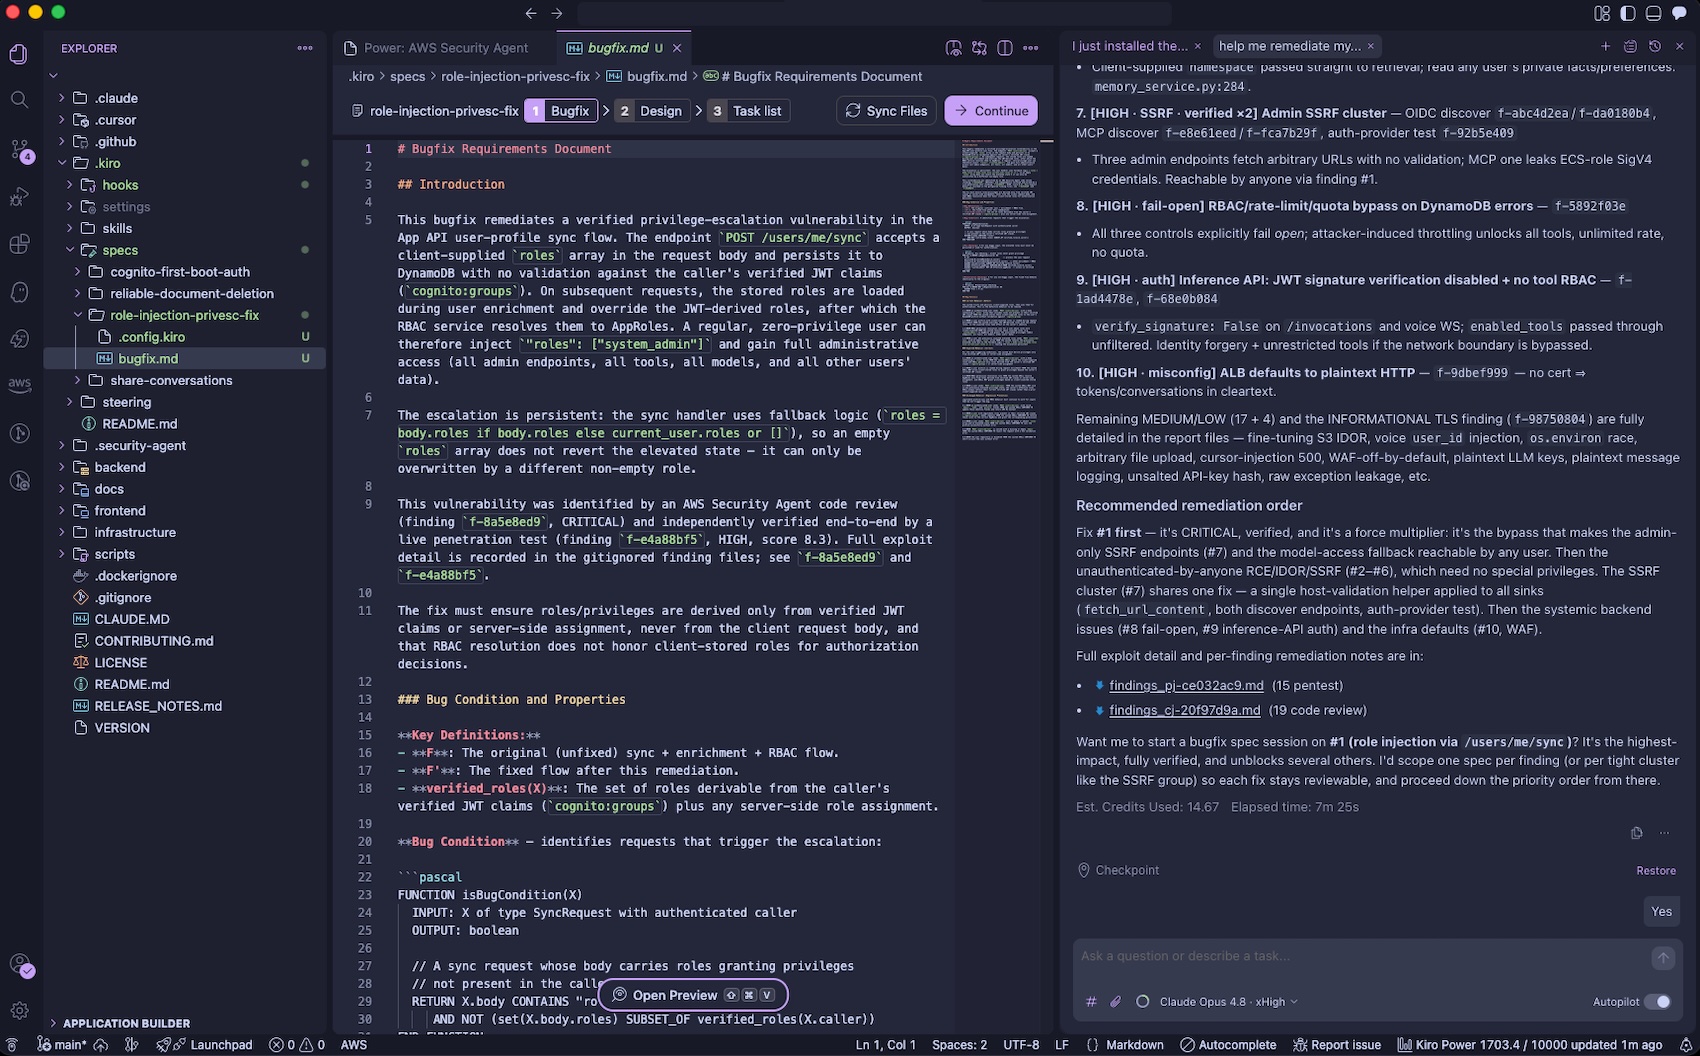
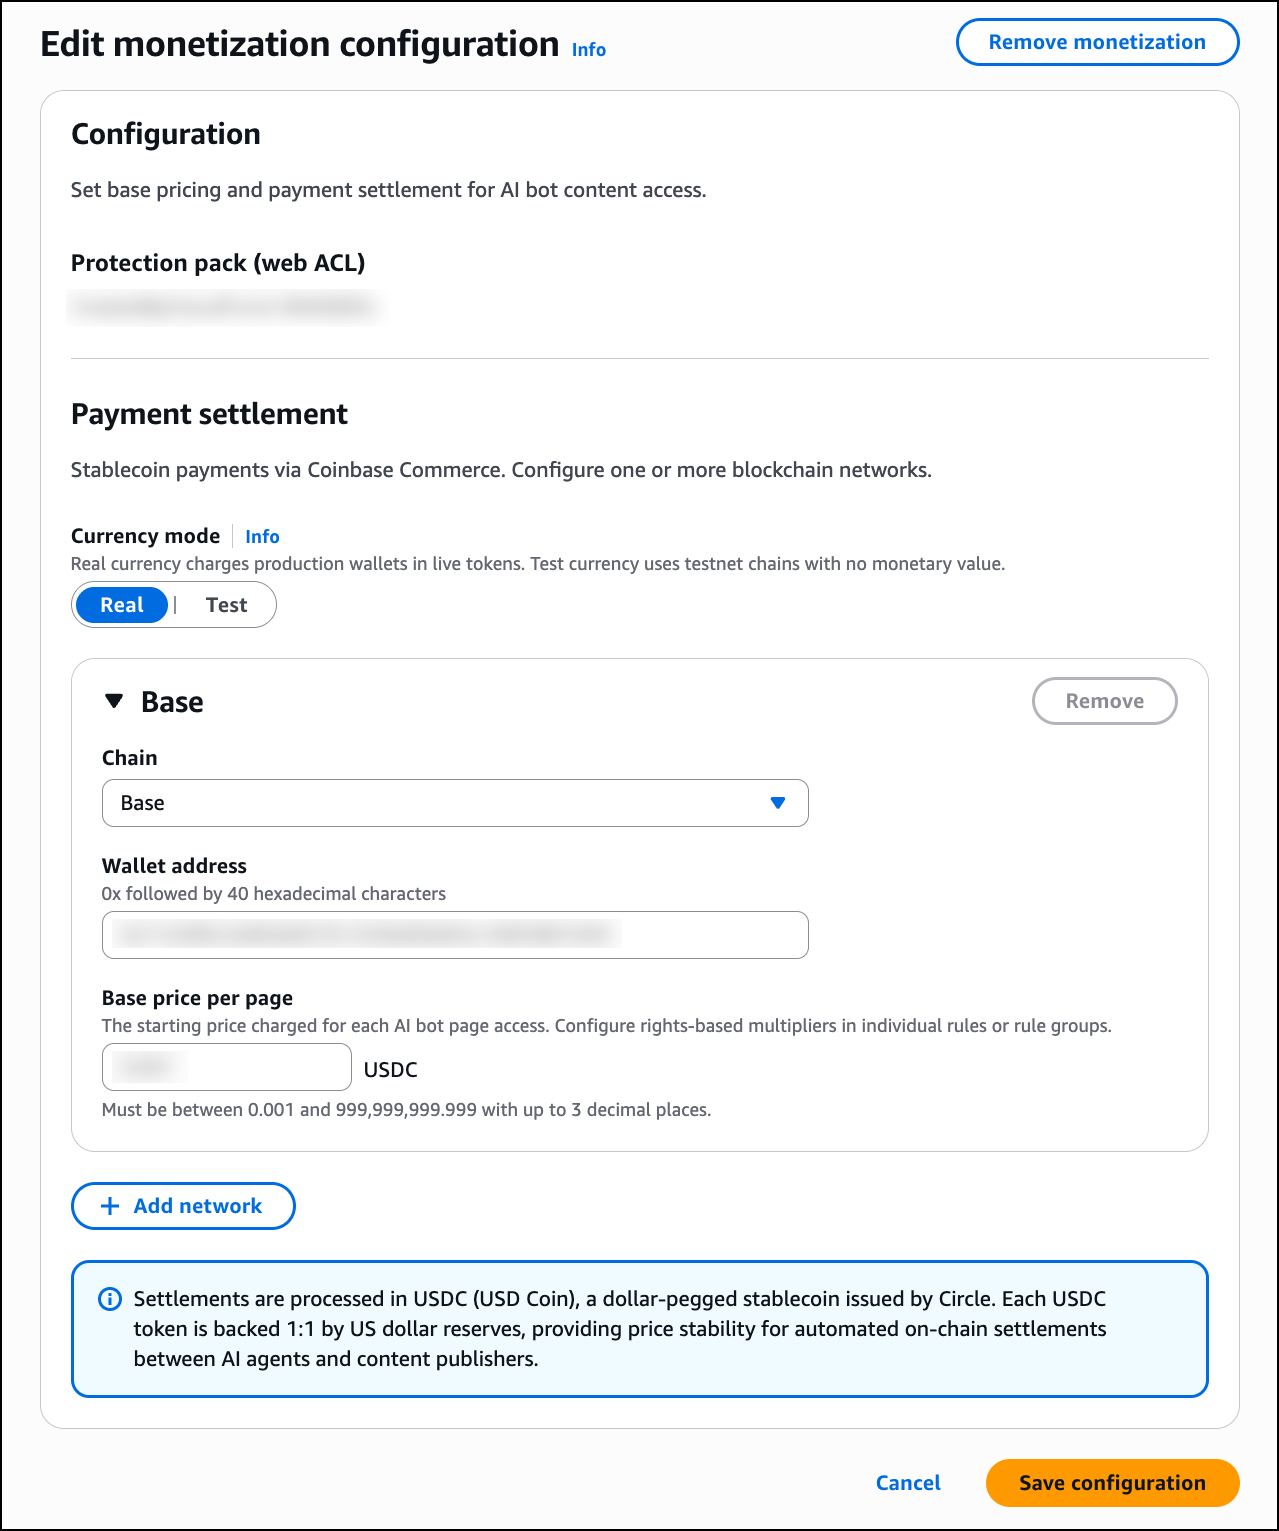
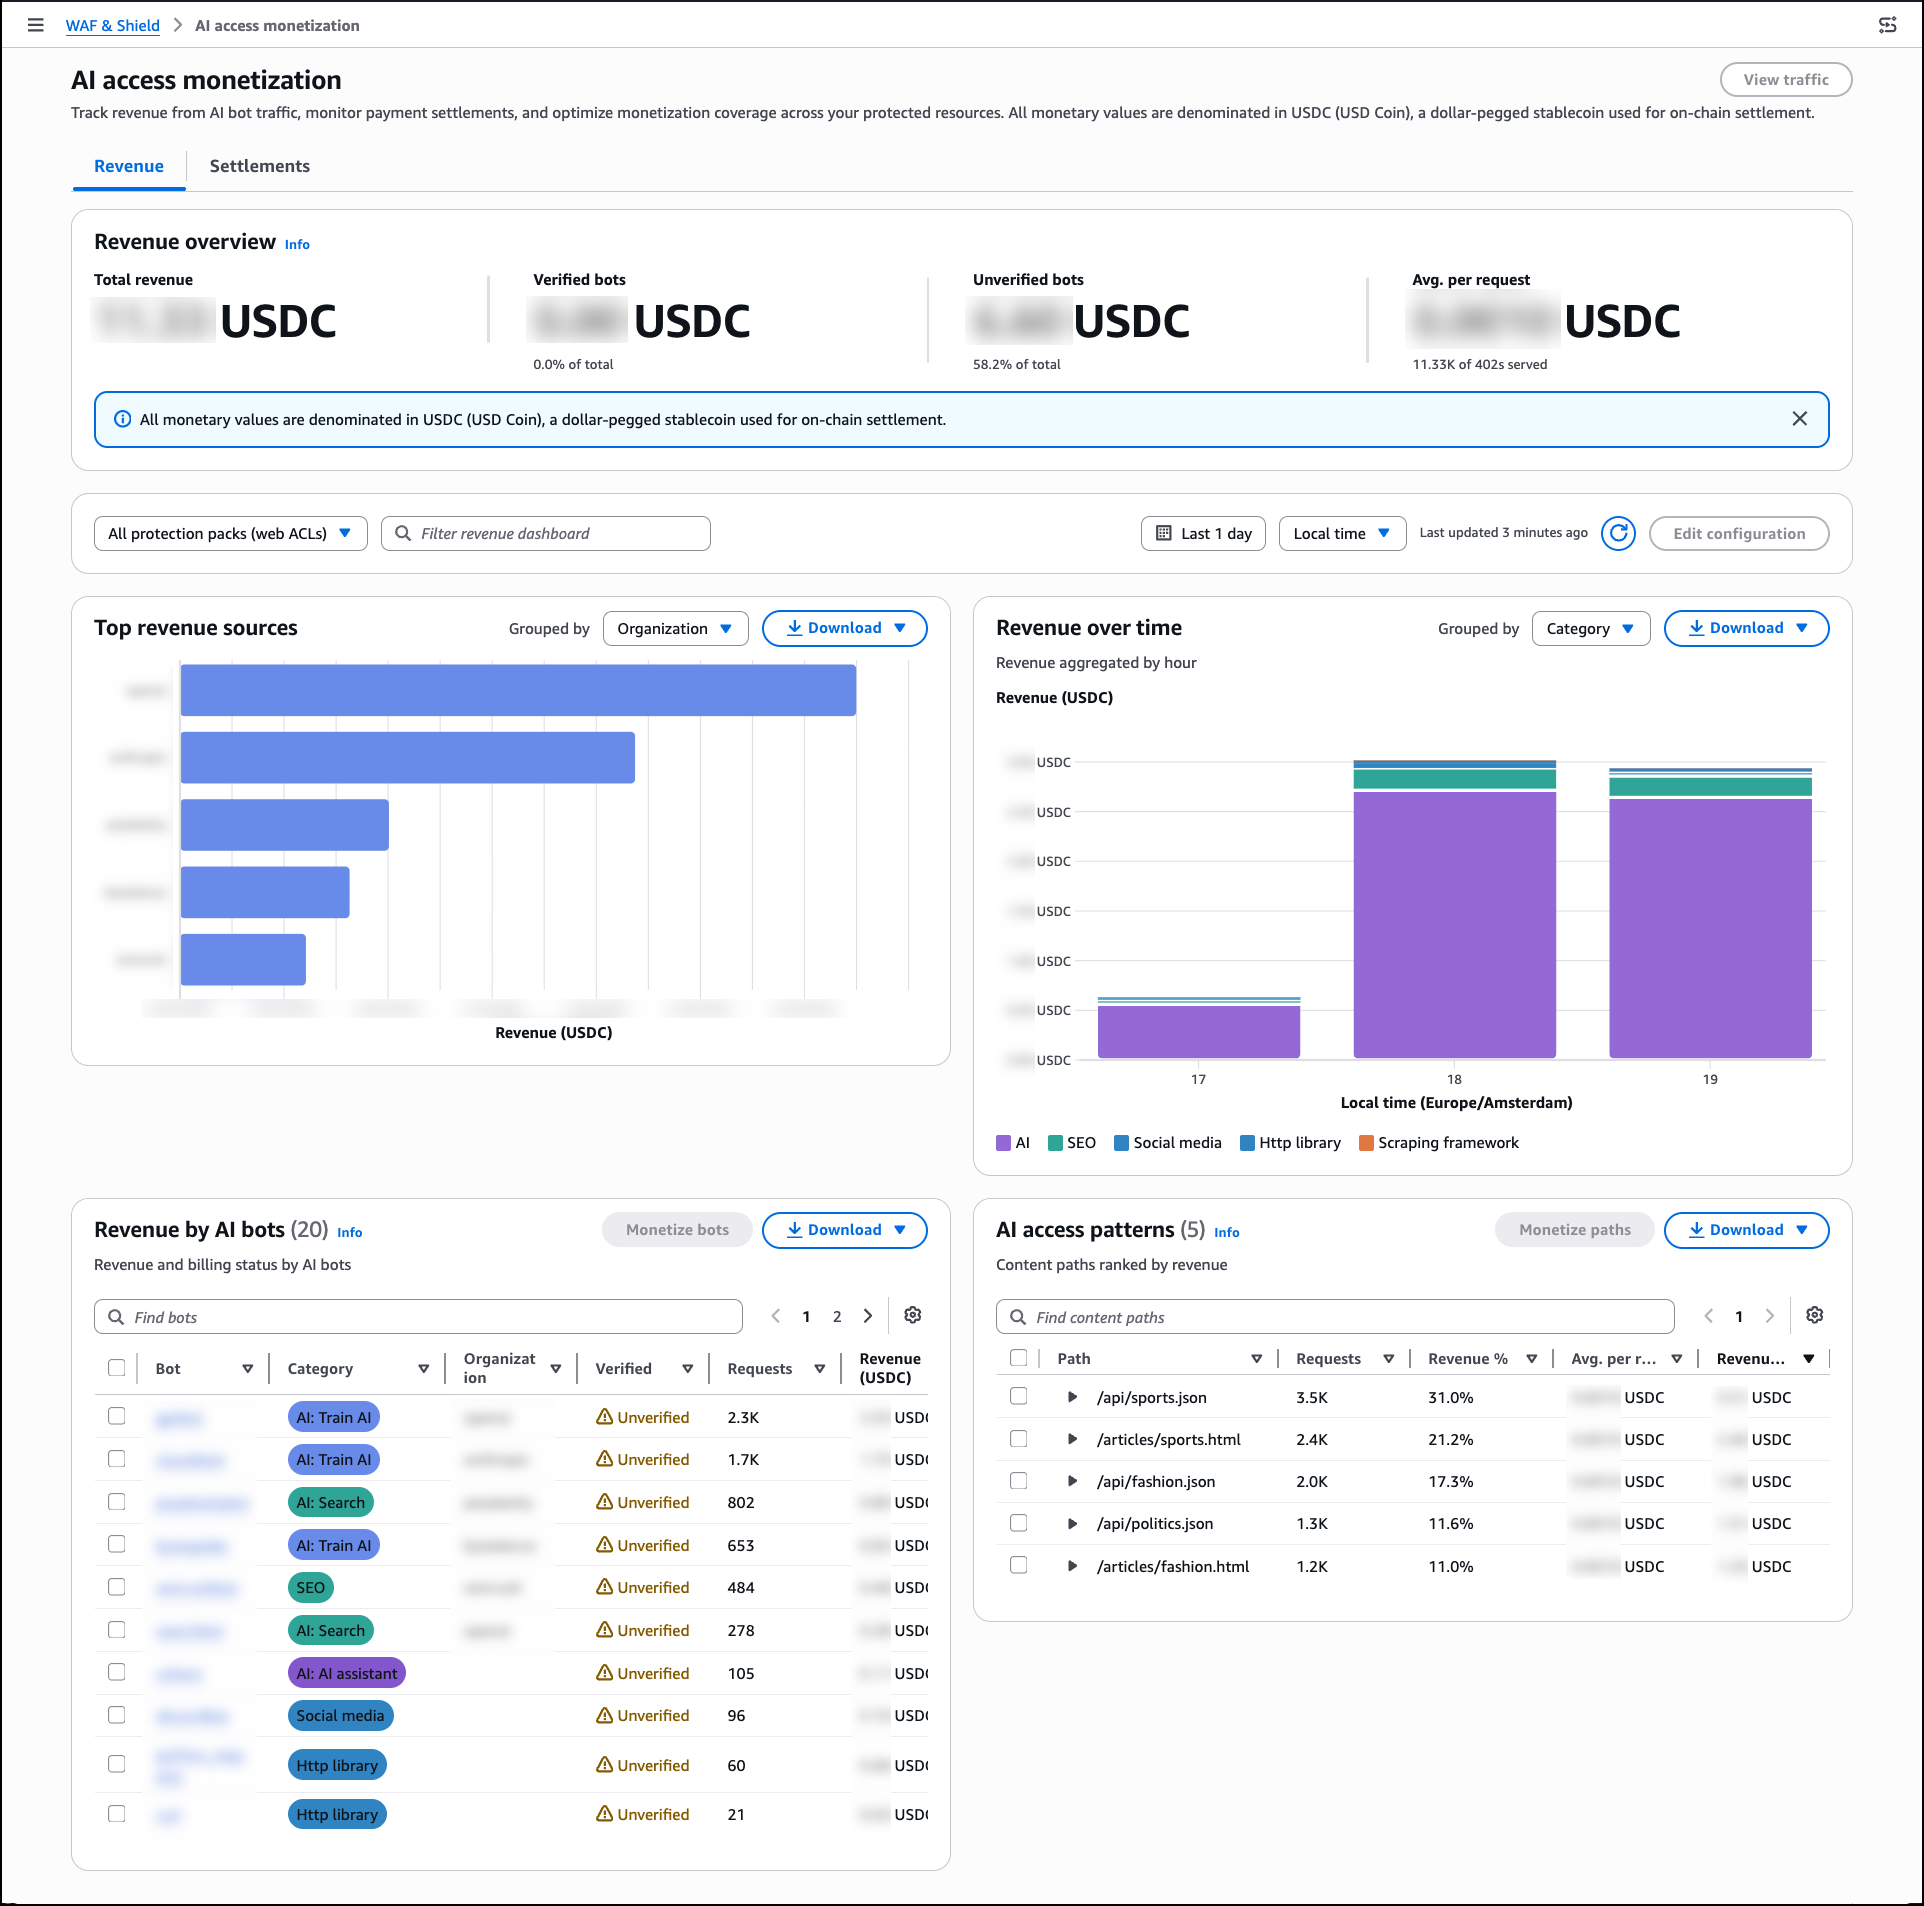
Image 1: AWS Transform – continuous modernization dashboard showing a portfolio overview of your technical debt findings across all connected repositories.
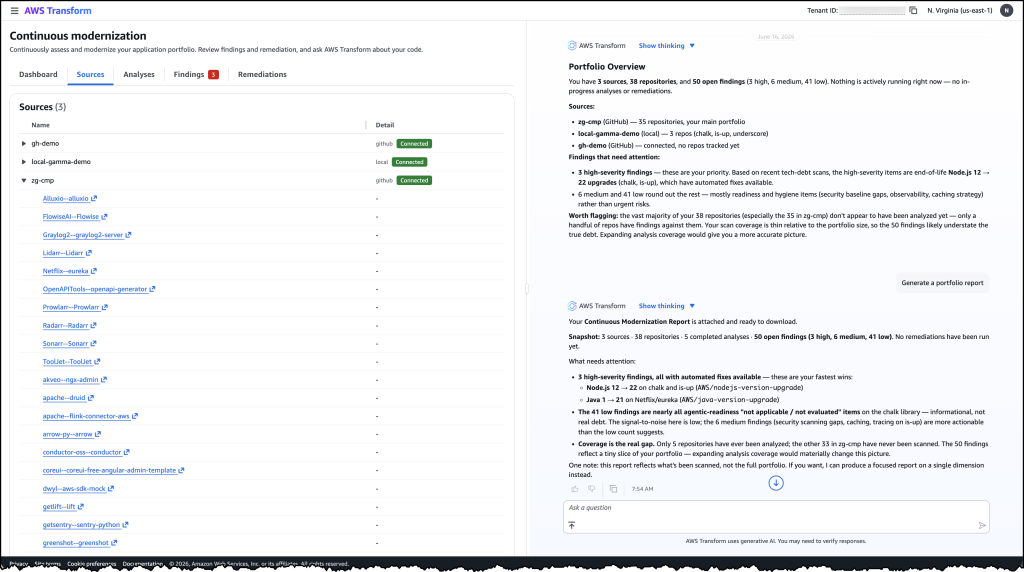
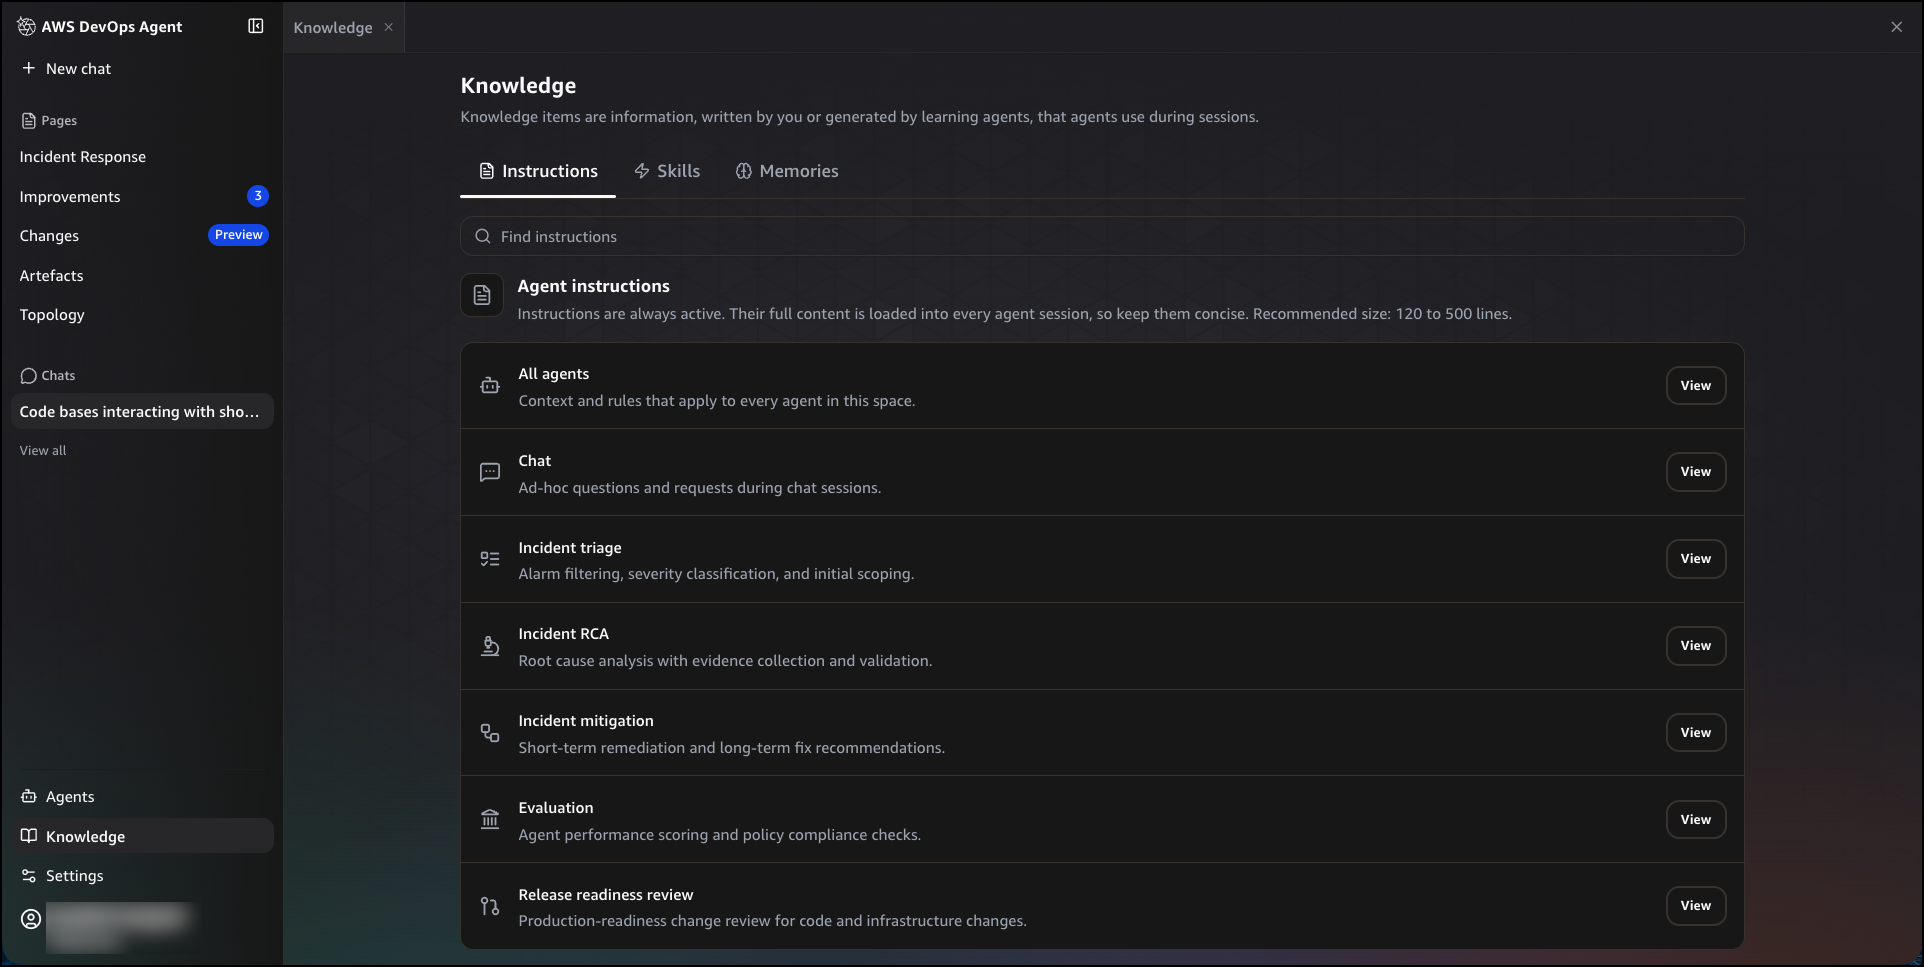
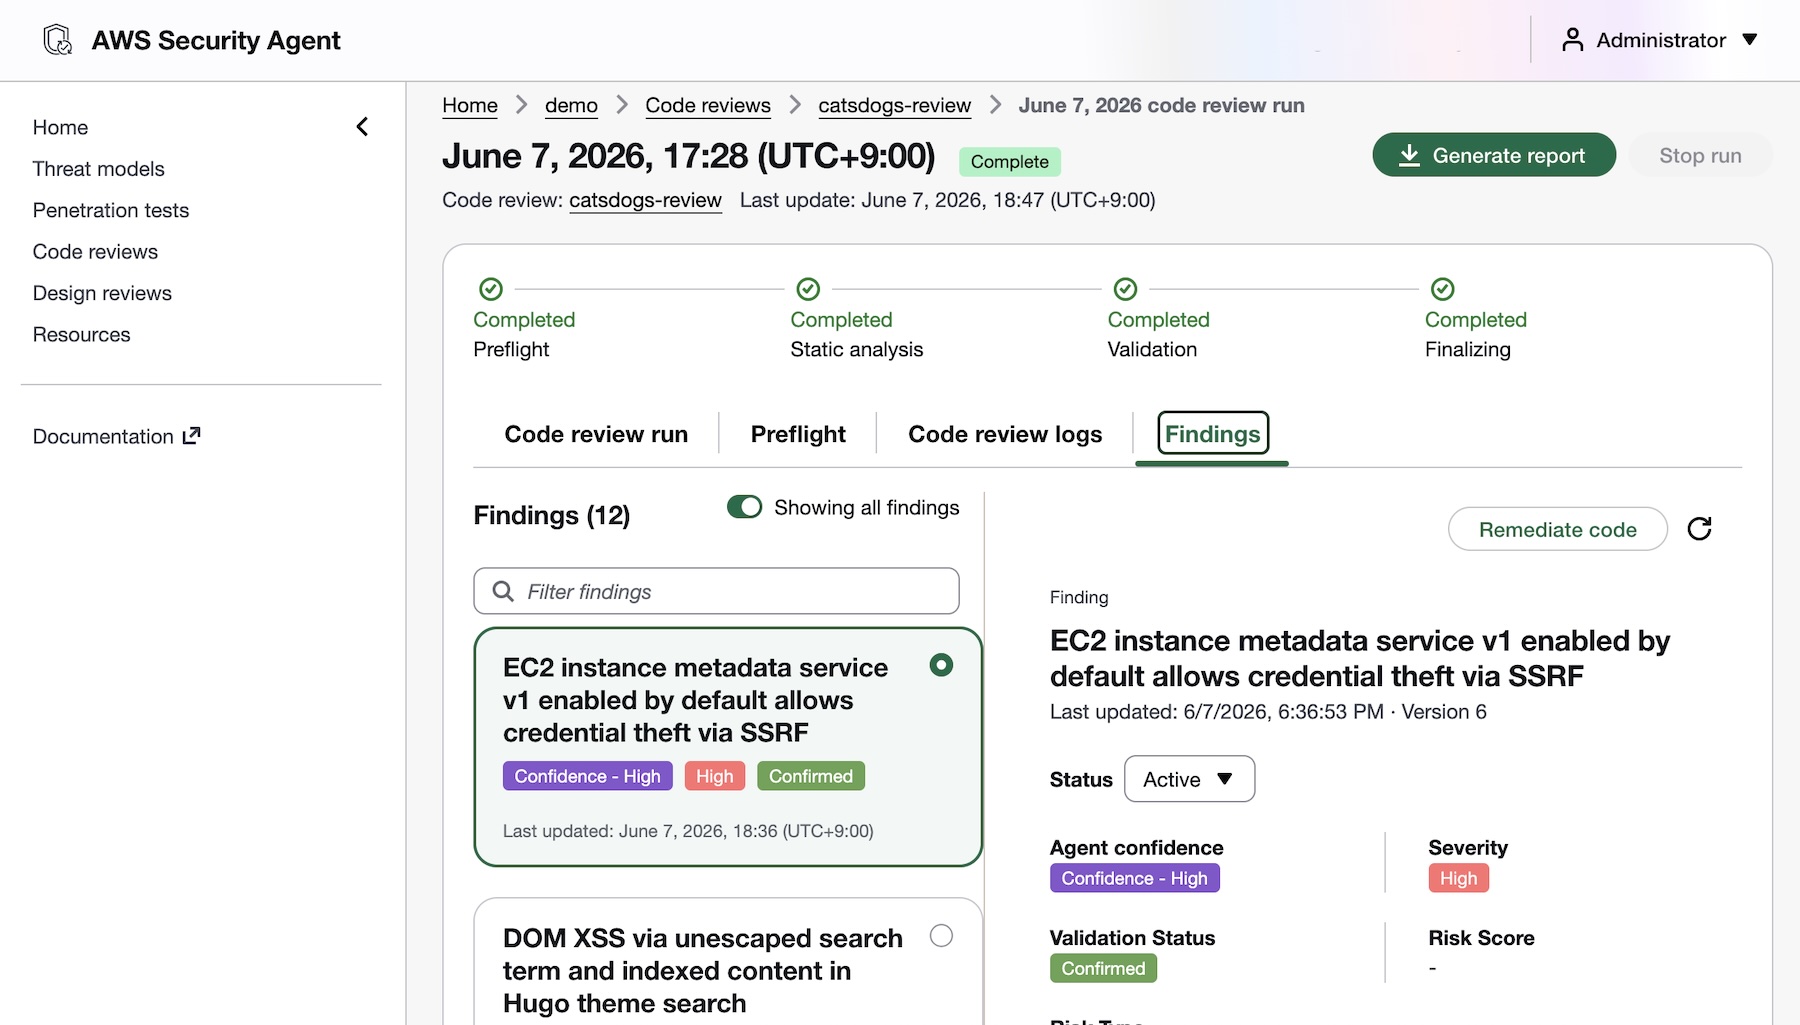
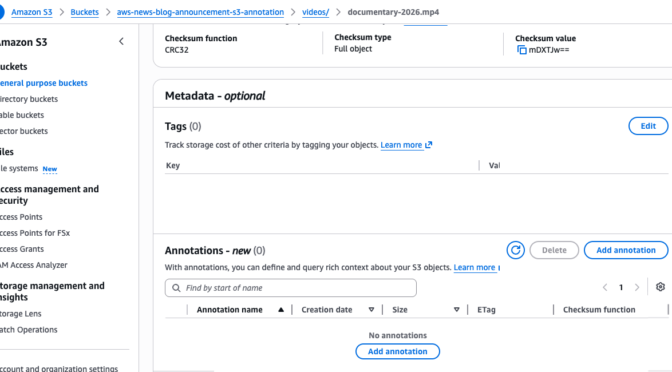
Image 2: The detailed findings view listing individual tech debt items by severity, category, and repository with their available remediation options.
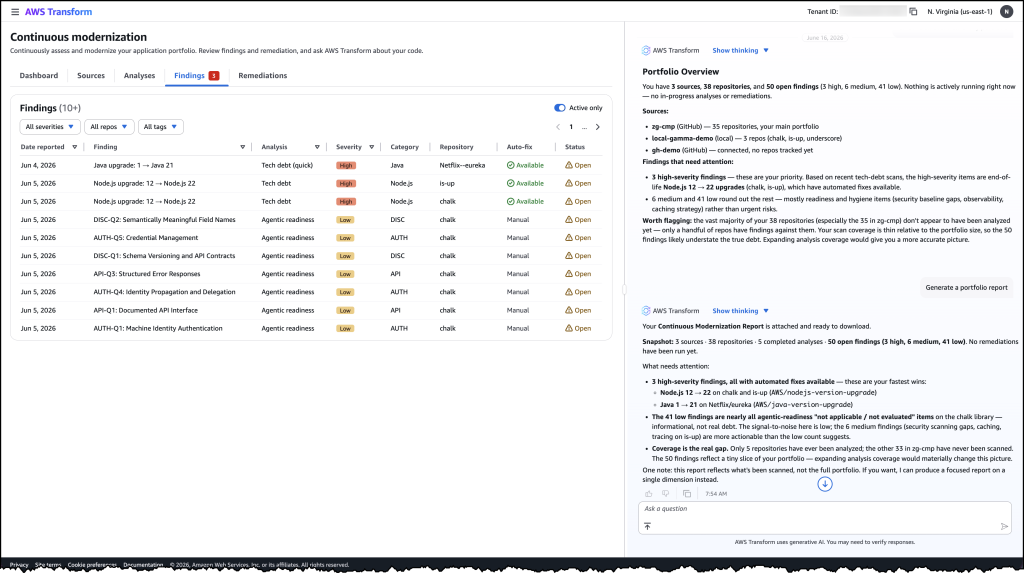
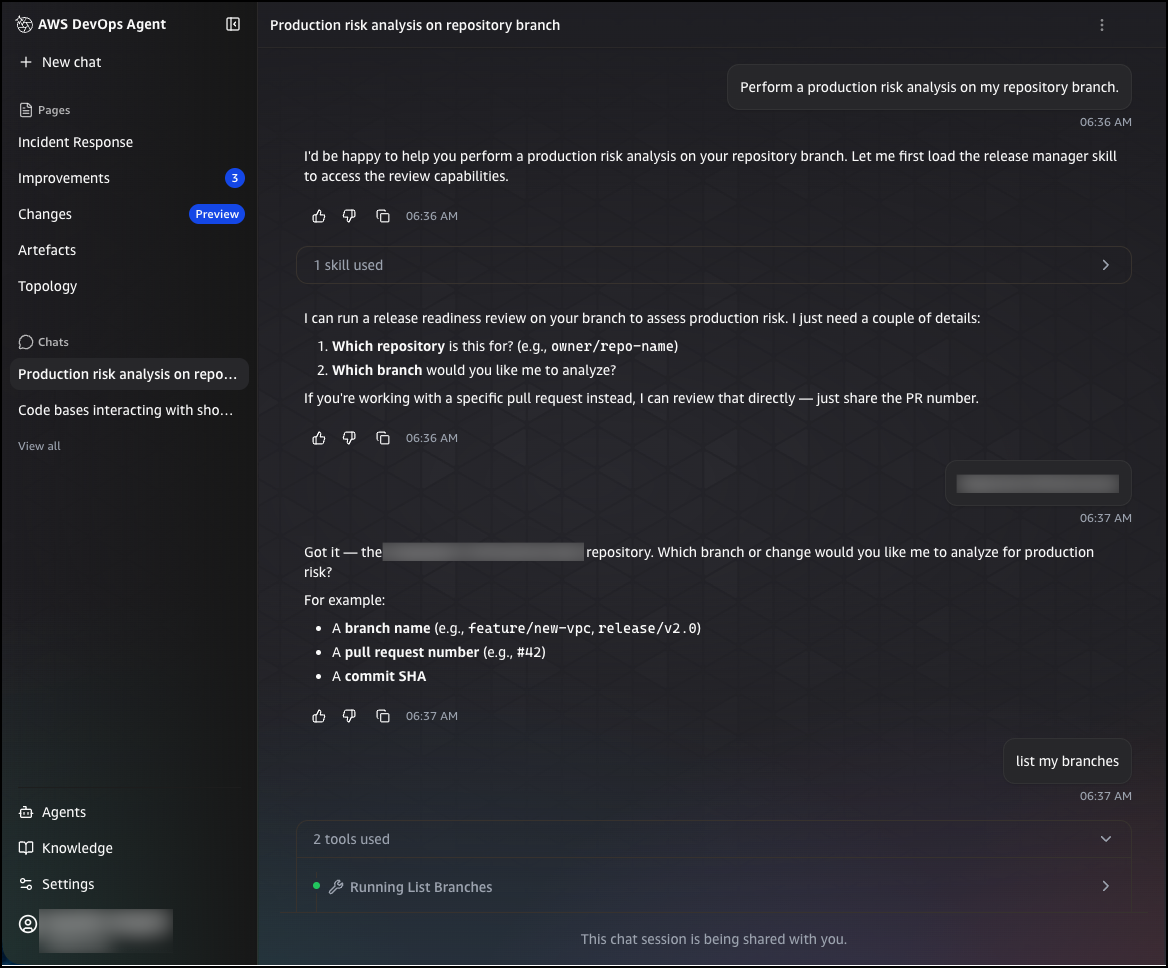
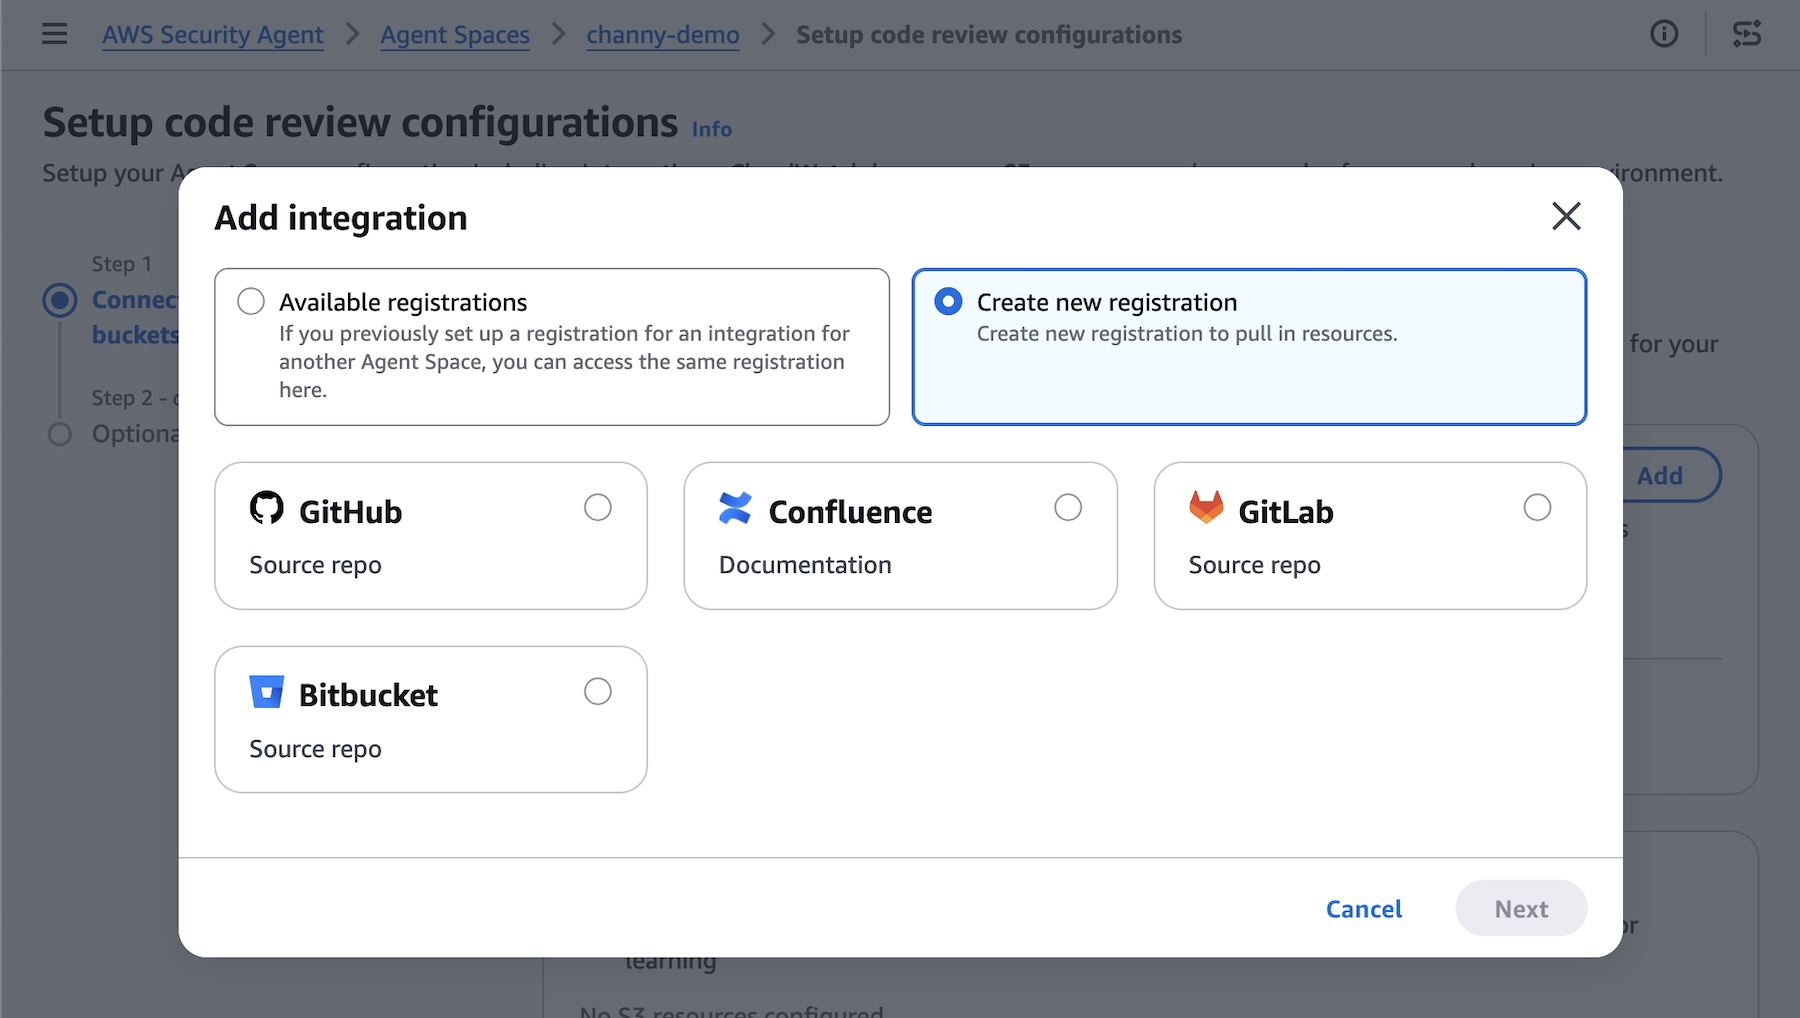
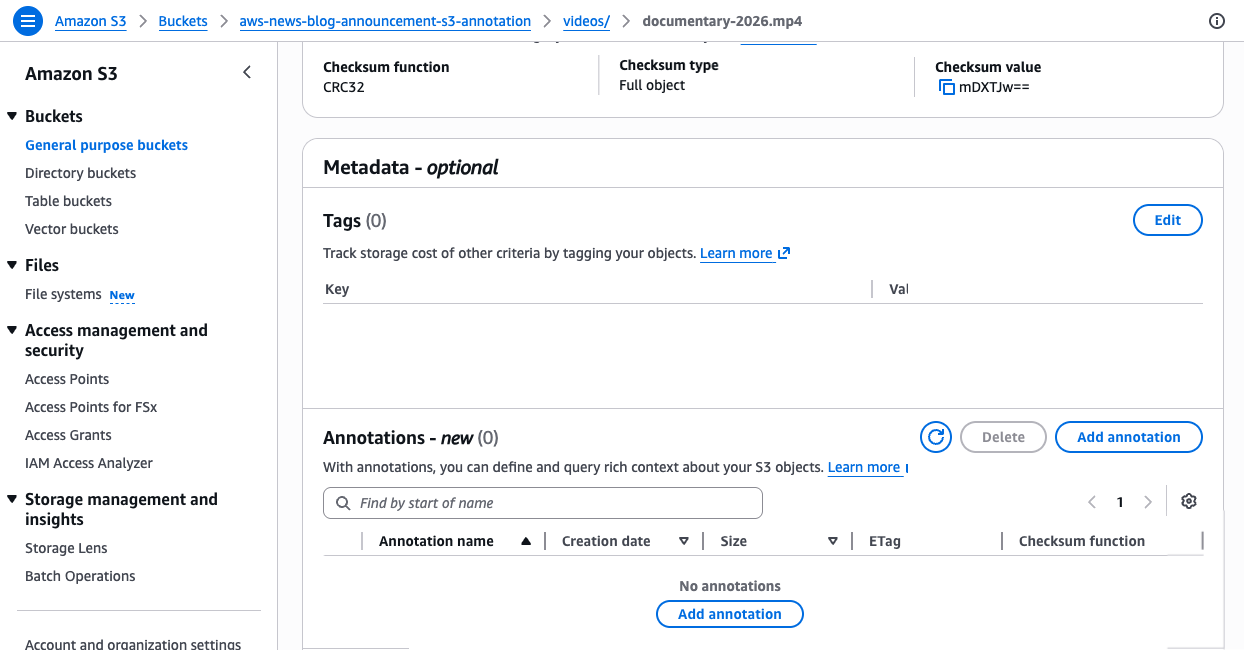
Image 3: The sources view showing connected repositories from GitHub and local environments that continuous modernization is tracking for analysis.
Faster ways to modernize
These capabilities support two distinct approaches to code modernization. In continuous mode, you can use continuous modernization to keep your codebases current as baselines evolve. Think of this as the day-to-day work of upgrading libraries, applying security patches, and enforcing coding standards across your organization.
For larger modernization projects, such as migrating from one framework to another or upgrading a major runtime version across hundreds of applications, you can use campaign mode for targeted, project-based modernization. AWS Transform custom continues to provide the flexible primitive for these larger efforts. AWS Transform – continuous modernization is purpose-built for the recurring, high-volume work that platform teams manage every day.
Now available
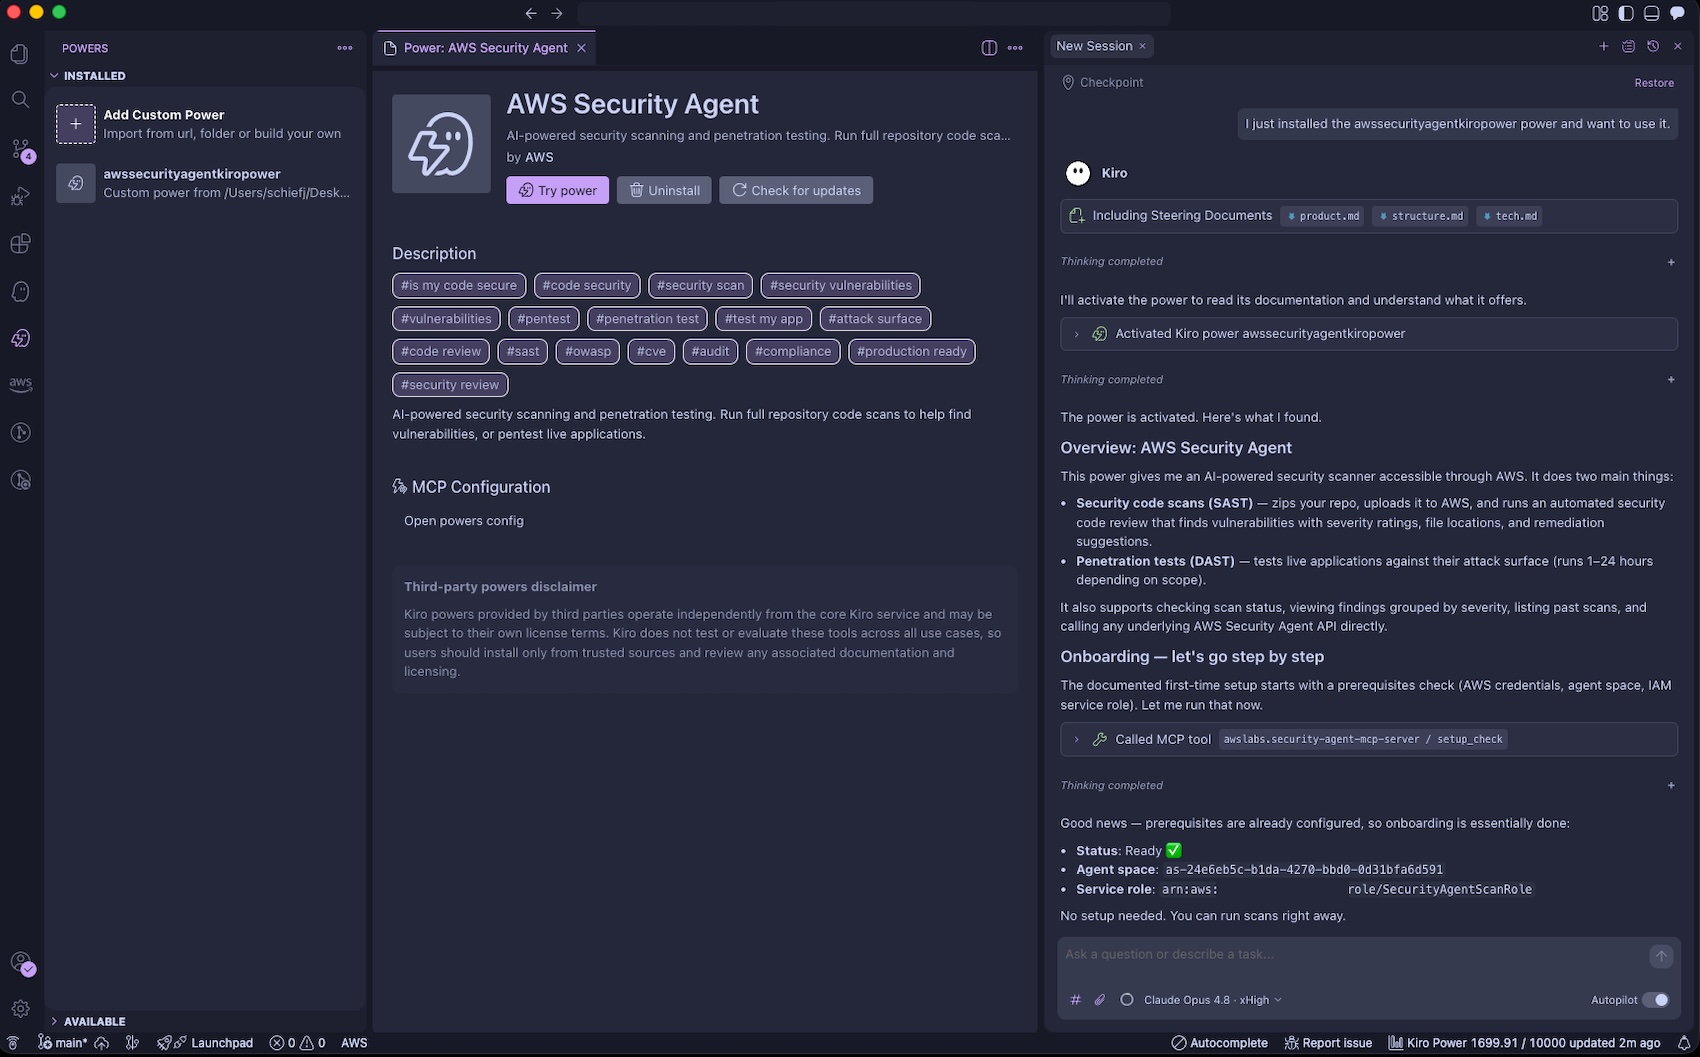
AWS Transform – continuous modernization (preview) is available today. You can get started through the AWS Transform web application, via the AWS Transform Kiro Power, or through MCP and skills for integration with your existing coding agents. To learn more, visit the AWS Transform documentation.