I’m excited to announce Amazon S3 Files, a new file system that seamlessly connects any AWS compute resource with Amazon Simple Storage Service (Amazon S3).
More than a decade ago, as an AWS trainer, I spent countless hours explaining the fundamental differences between object storage and file systems. My favorite analogy was comparing S3 objects to books in a library (you can’t edit a page, you need to replace the whole book) versus files on your computer that you can modify page by page. I drew diagrams, created metaphors, and helped customers understand why they needed different storage types for different workloads. Well, today that distinction becomes a bit more flexible.
With S3 Files, Amazon S3 is the first and only cloud object store that offers fully-featured, high-performance file system access to your data. It makes your buckets accessible as file systems. This means changes to data on the file system are automatically reflected in the S3 bucket and you have fine-grained control over synchronization. S3 Files can be attached to multiple compute resources enabling data sharing across clusters without duplication.
Until now, you had to choose between Amazon S3 cost, durability, and the services that can natively consume data from it or a file system’s interactive capabilities. S3 Files eliminates that tradeoff. S3 becomes the central hub for all your organization’s data. It’s accessible directly from any AWS compute instance, container, or function, whether you’re running production applications, training ML models, or building agentic AI systems.
You can access any general purpose bucket as a native file system on your Amazon Elastic Compute Cloud (Amazon EC2) instances, containers running on Amazon Elastic Container Service (Amazon ECS) or Amazon Elastic Kubernetes Service (Amazon EKS), or AWS Lambda functions. The file system presents S3 objects as files and directories, supporting all Network File System (NFS) v4.1+ operations like creating, reading, updating, and deleting files.
As you work with specific files and directories through the file system, associated file metadata and contents are placed onto the file system’s high-performance storage. By default, files that benefit from low-latency access are stored and served from the high performance storage. For files not stored on high performance storage such as those needing large sequential reads, S3 Files automatically serves those files directly from Amazon S3 to maximize throughput. For byte-range reads, only the requested bytes are transferred, minimizing data movement and costs.
The system also supports intelligent pre-fetching to anticipate your data access needs. You also have fine-grained control over what gets stored on the file system’s high performance storage. You can decide whether to load full file data or metadata only, which means you can optimize for your specific access patterns.
Under the hood, S3 Files uses Amazon Elastic File System (Amazon EFS) and delivers ~1ms latencies for active data. The file system supports concurrent access from multiple compute resources with NFS close-to-open consistency, making it ideal for interactive, shared workloads that mutate data, from agentic AI agents collaborating through file-based tools to ML training pipelines processing datasets.
Let me show you how to get started.
Creating my first Amazon S3 file system, mounting, and using it from an EC2 instance is straightforward.
I have an EC2 instance and a general purpose bucket. In this demo, I configure an S3 file system and access the bucket from an EC2 instance, using regular file system commands.
For this demo, I use the AWS Management Console. You can also use the AWS Command Line Interface (AWS CLI) or infrastructure as code (IaC).
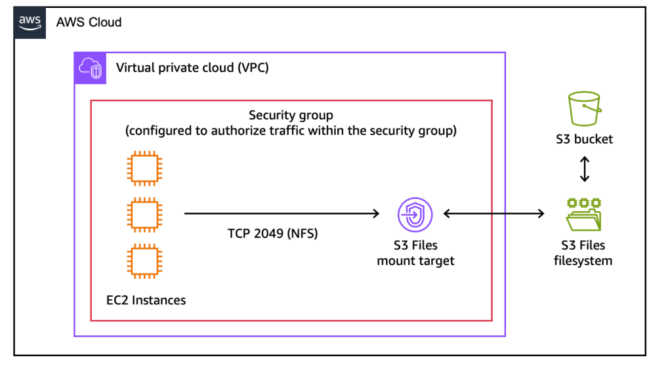
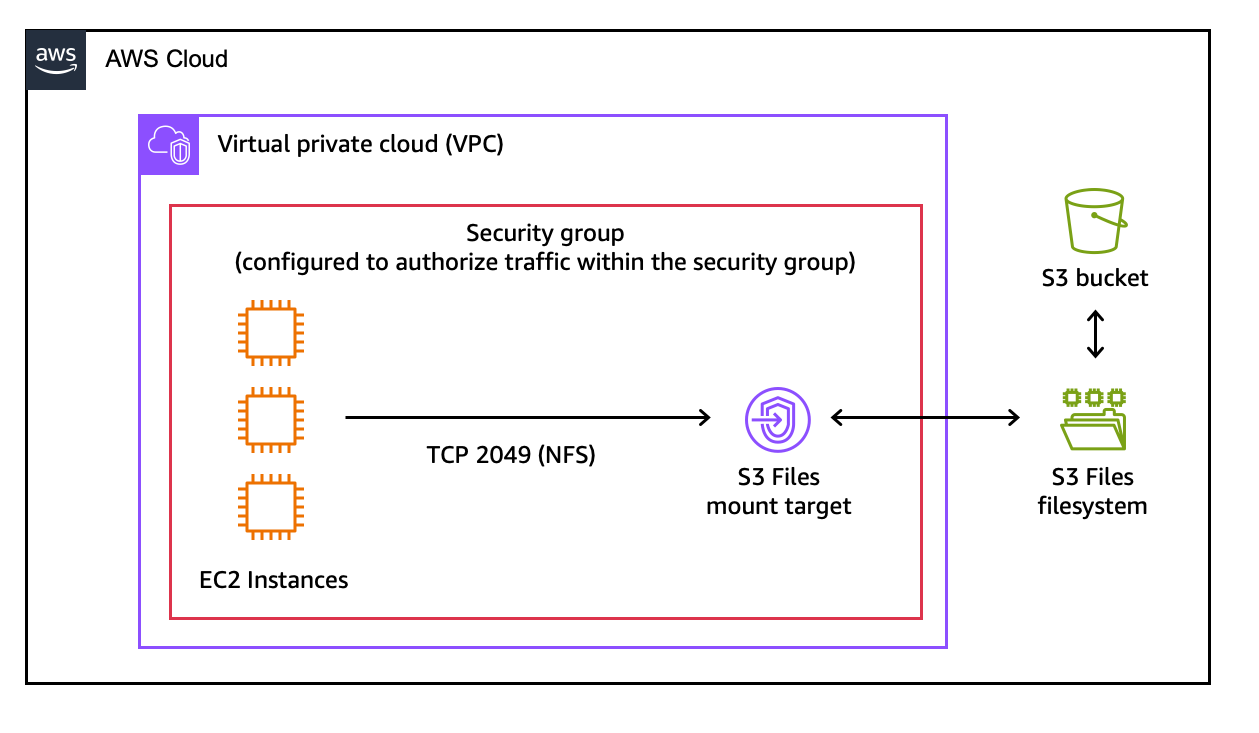
Here is the architecture diagram for this demo.
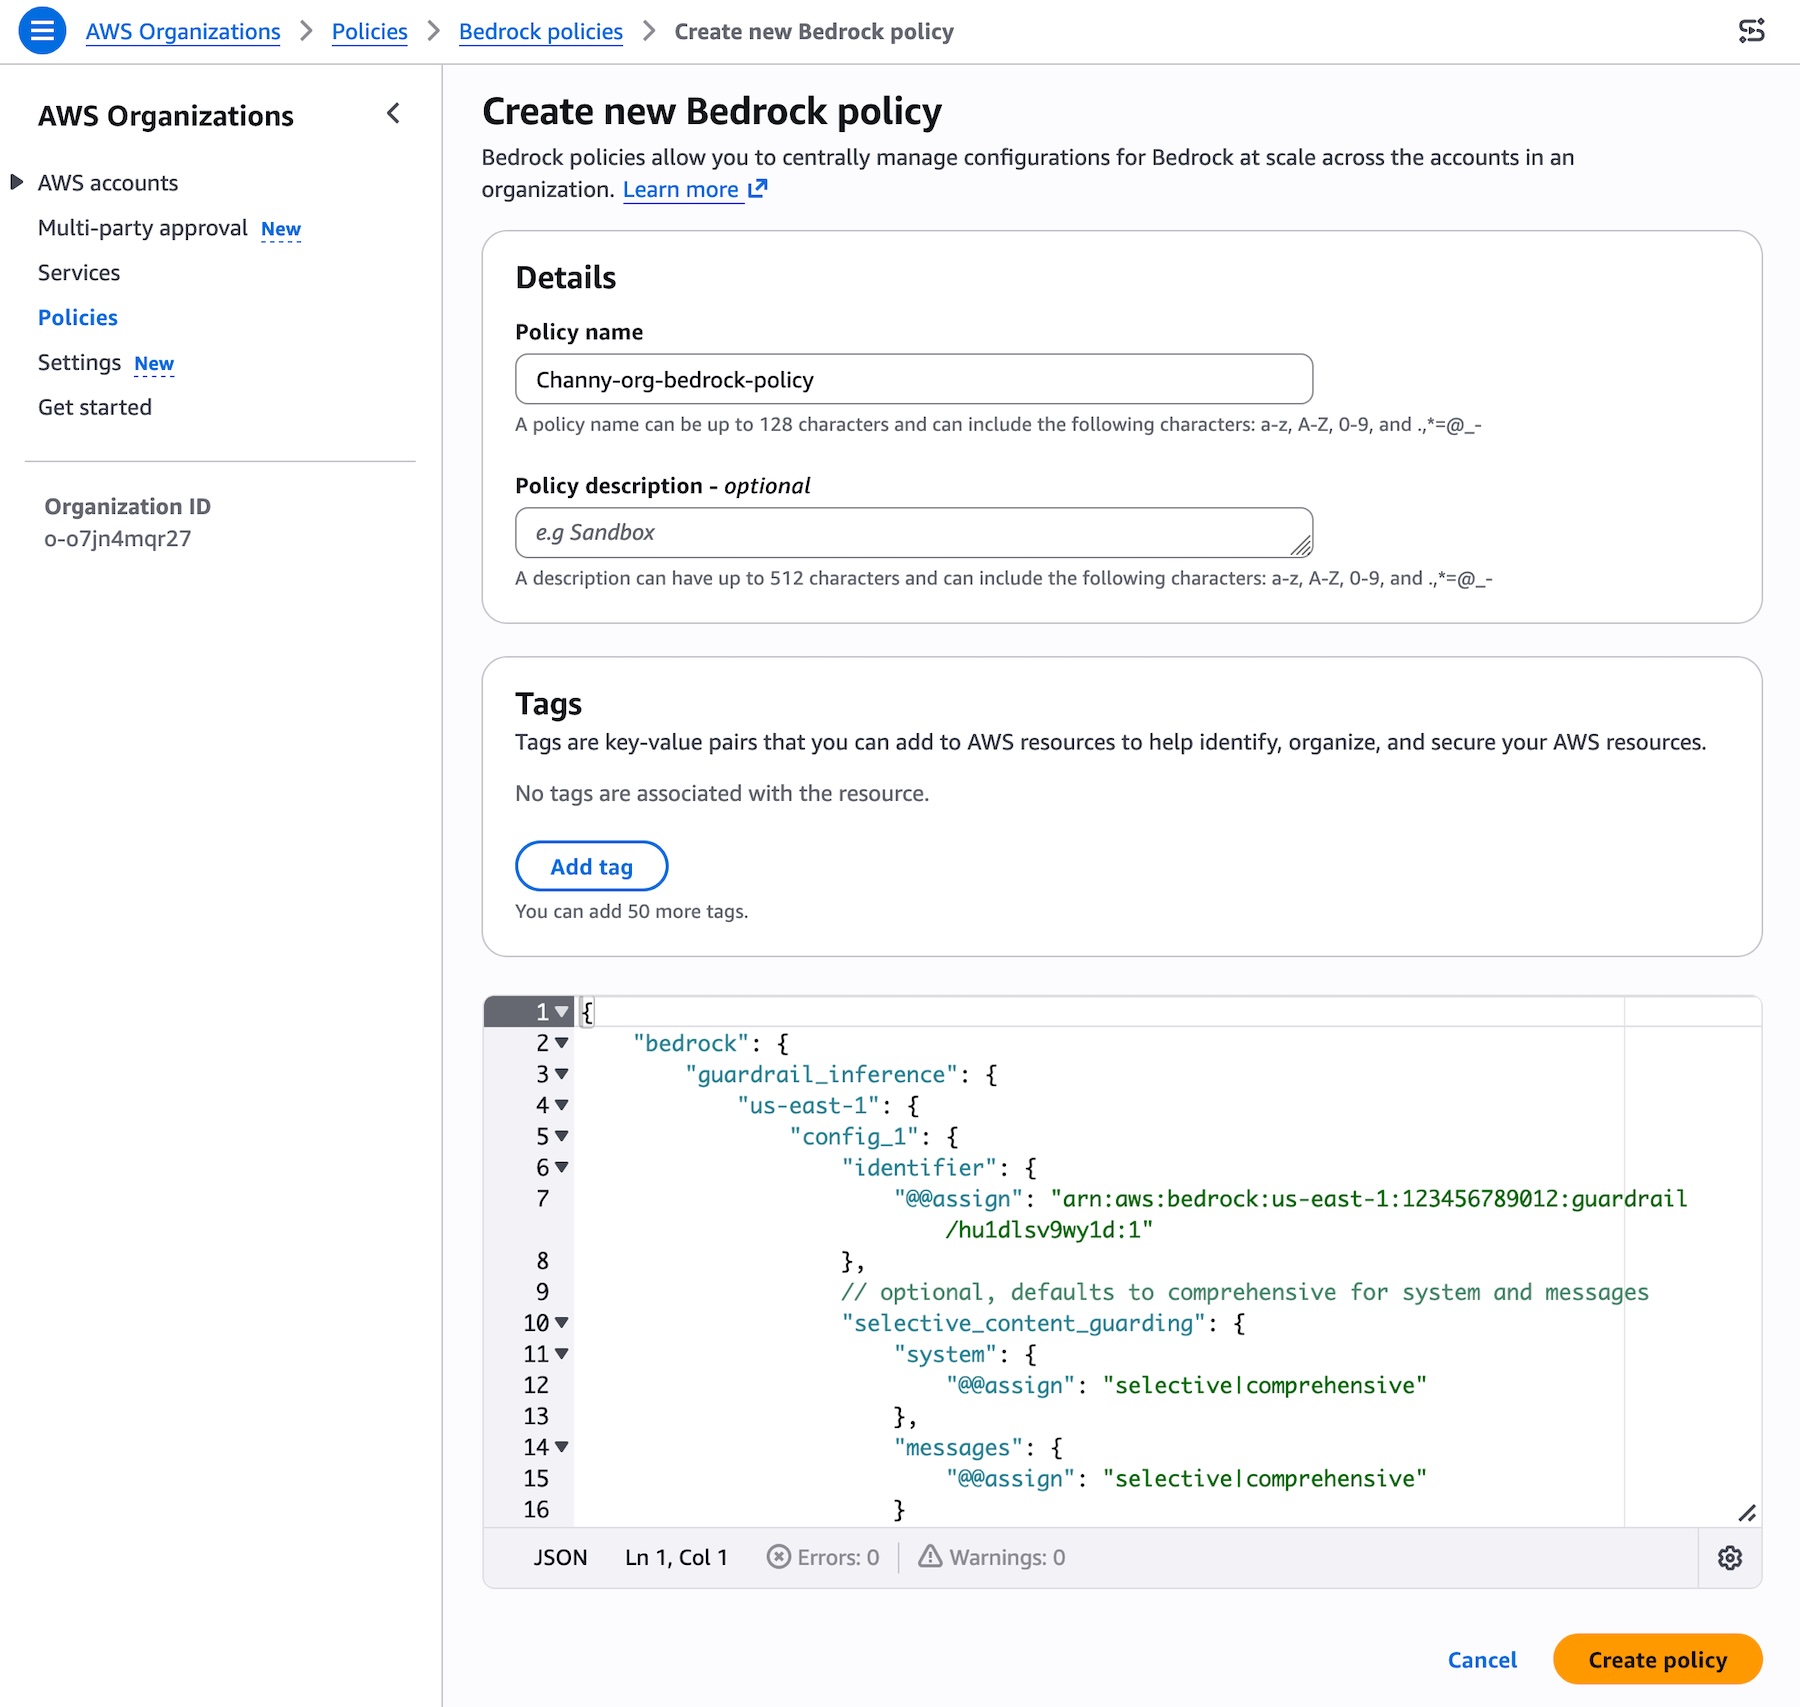
 Step 1: Create an S3 file system.
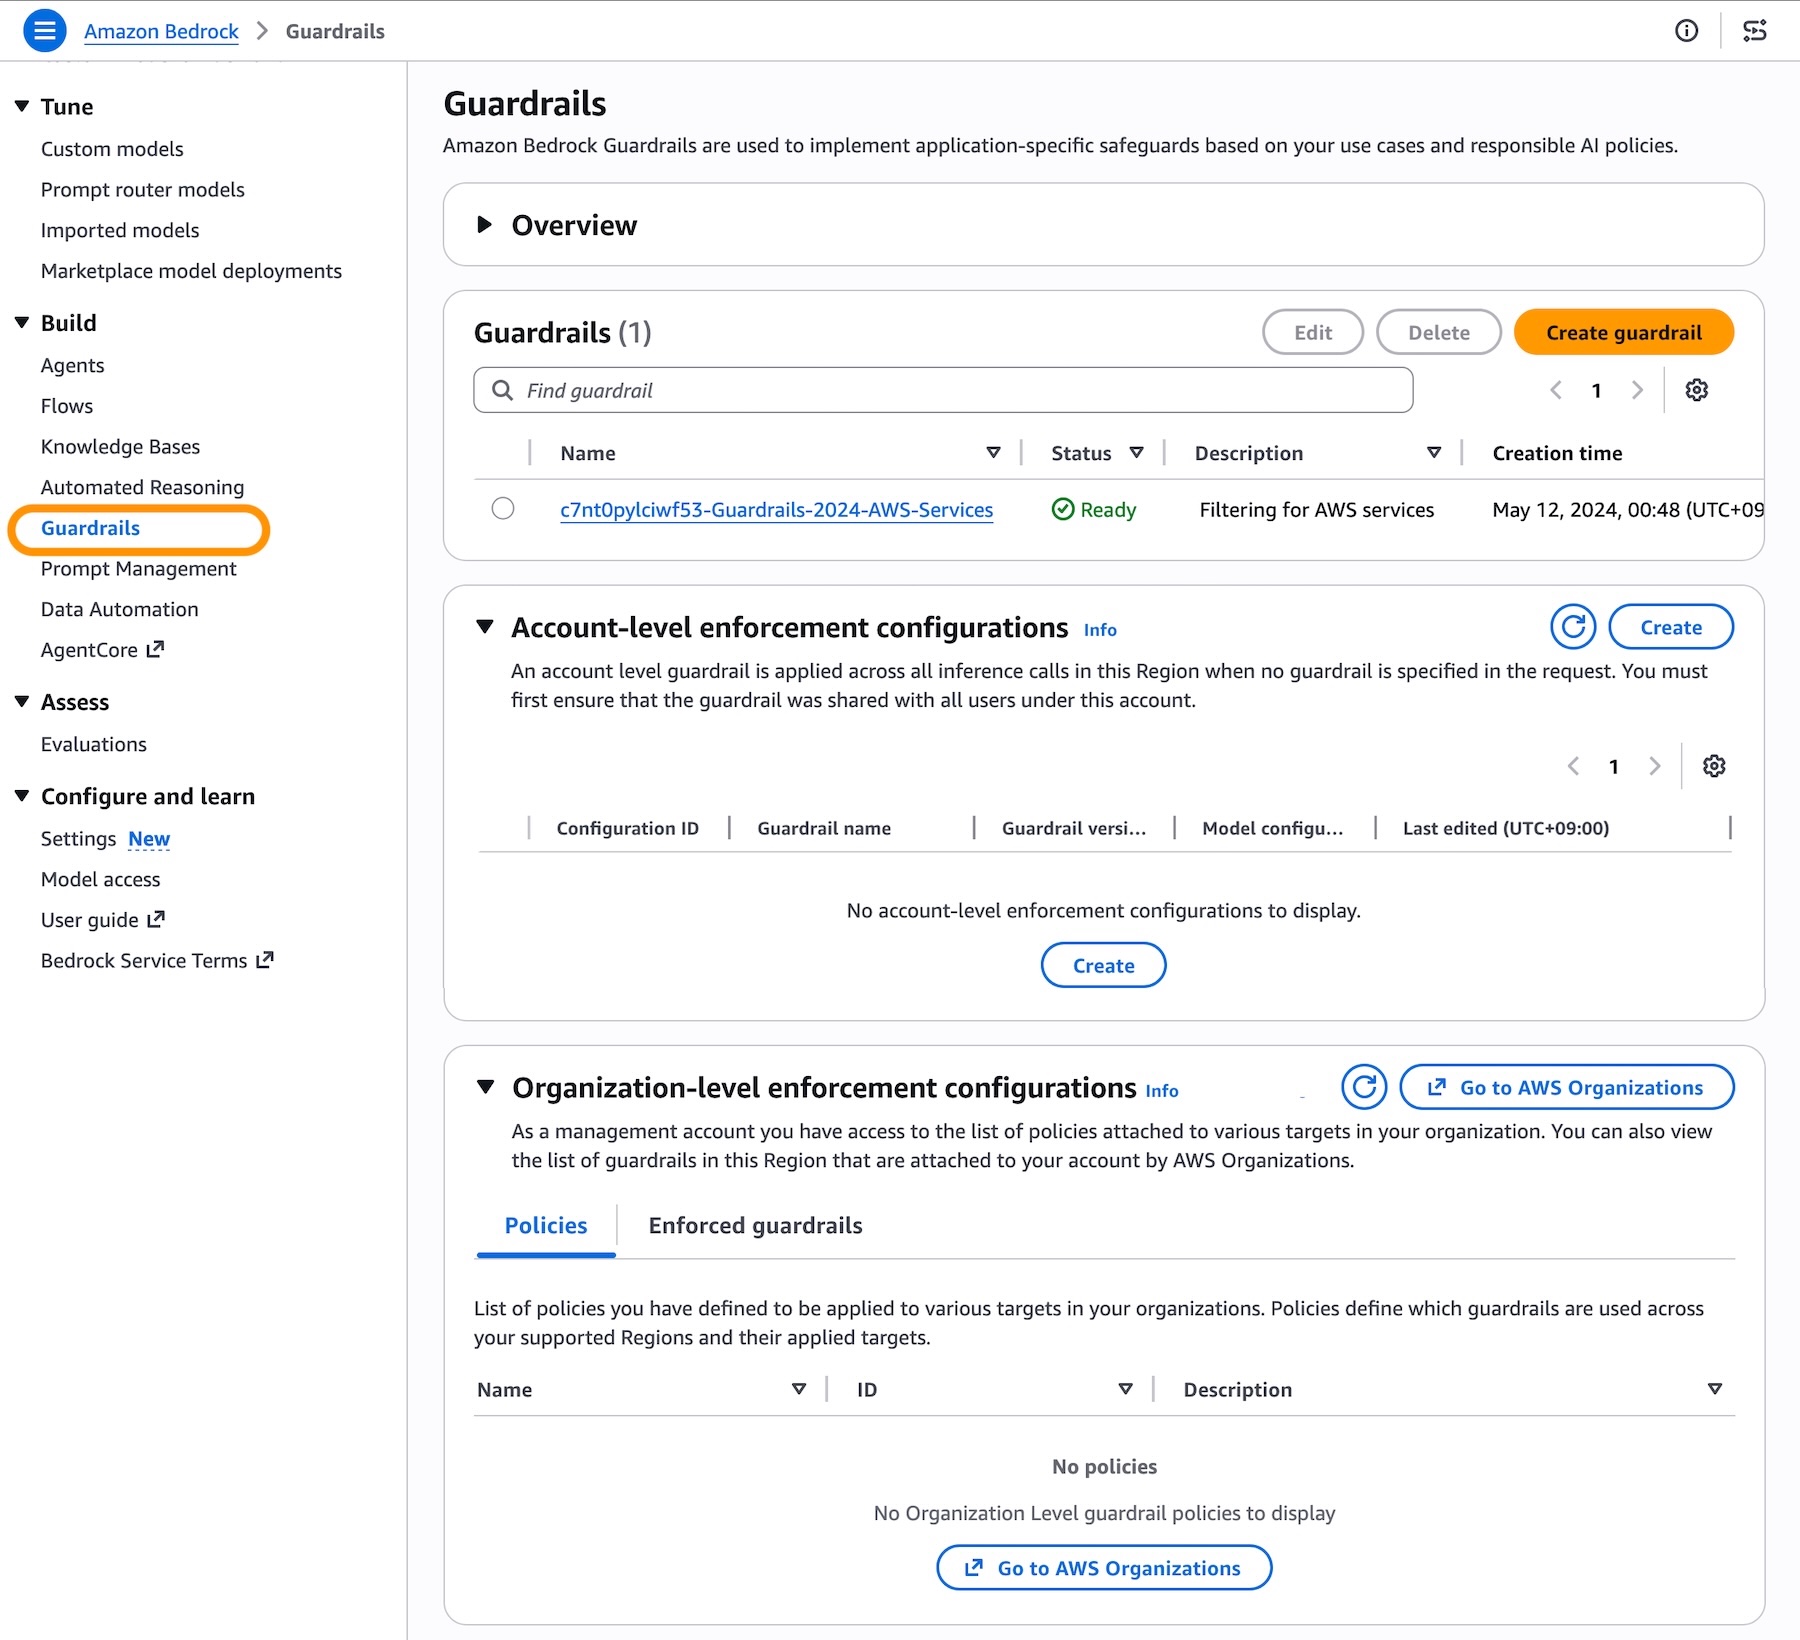
On the Amazon S3 section of the console, I choose File systems and then Create file system.
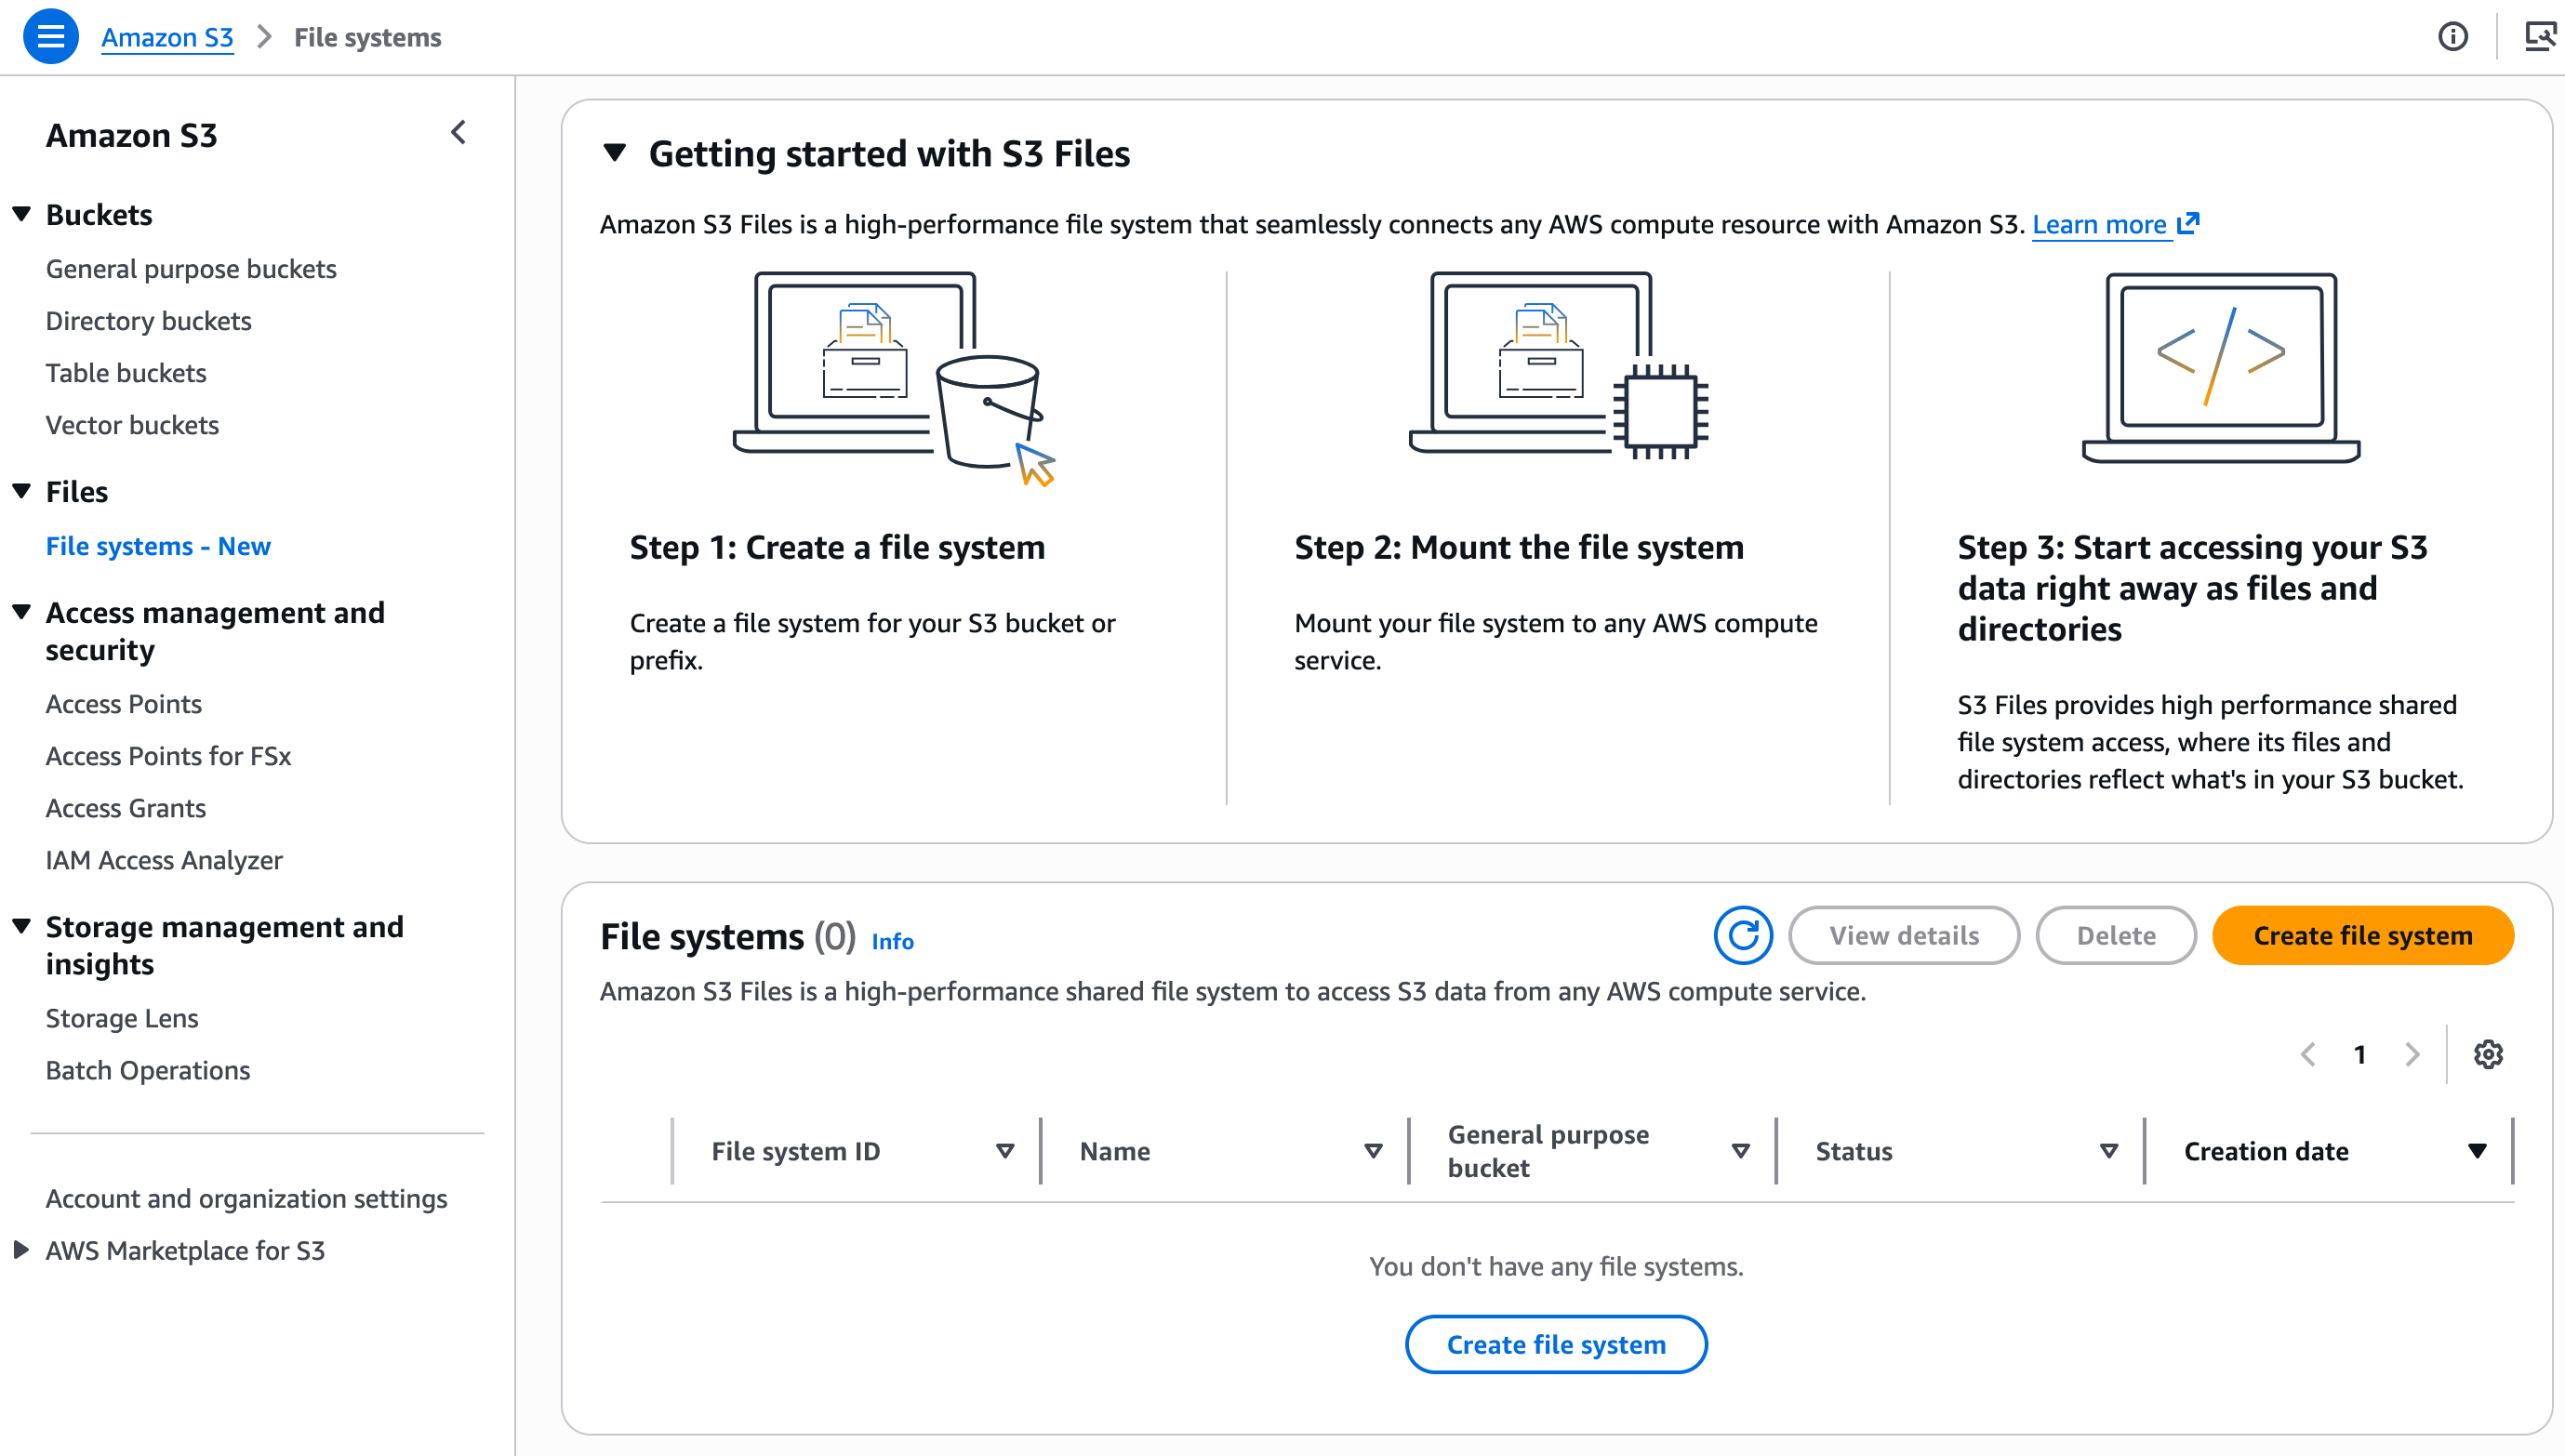
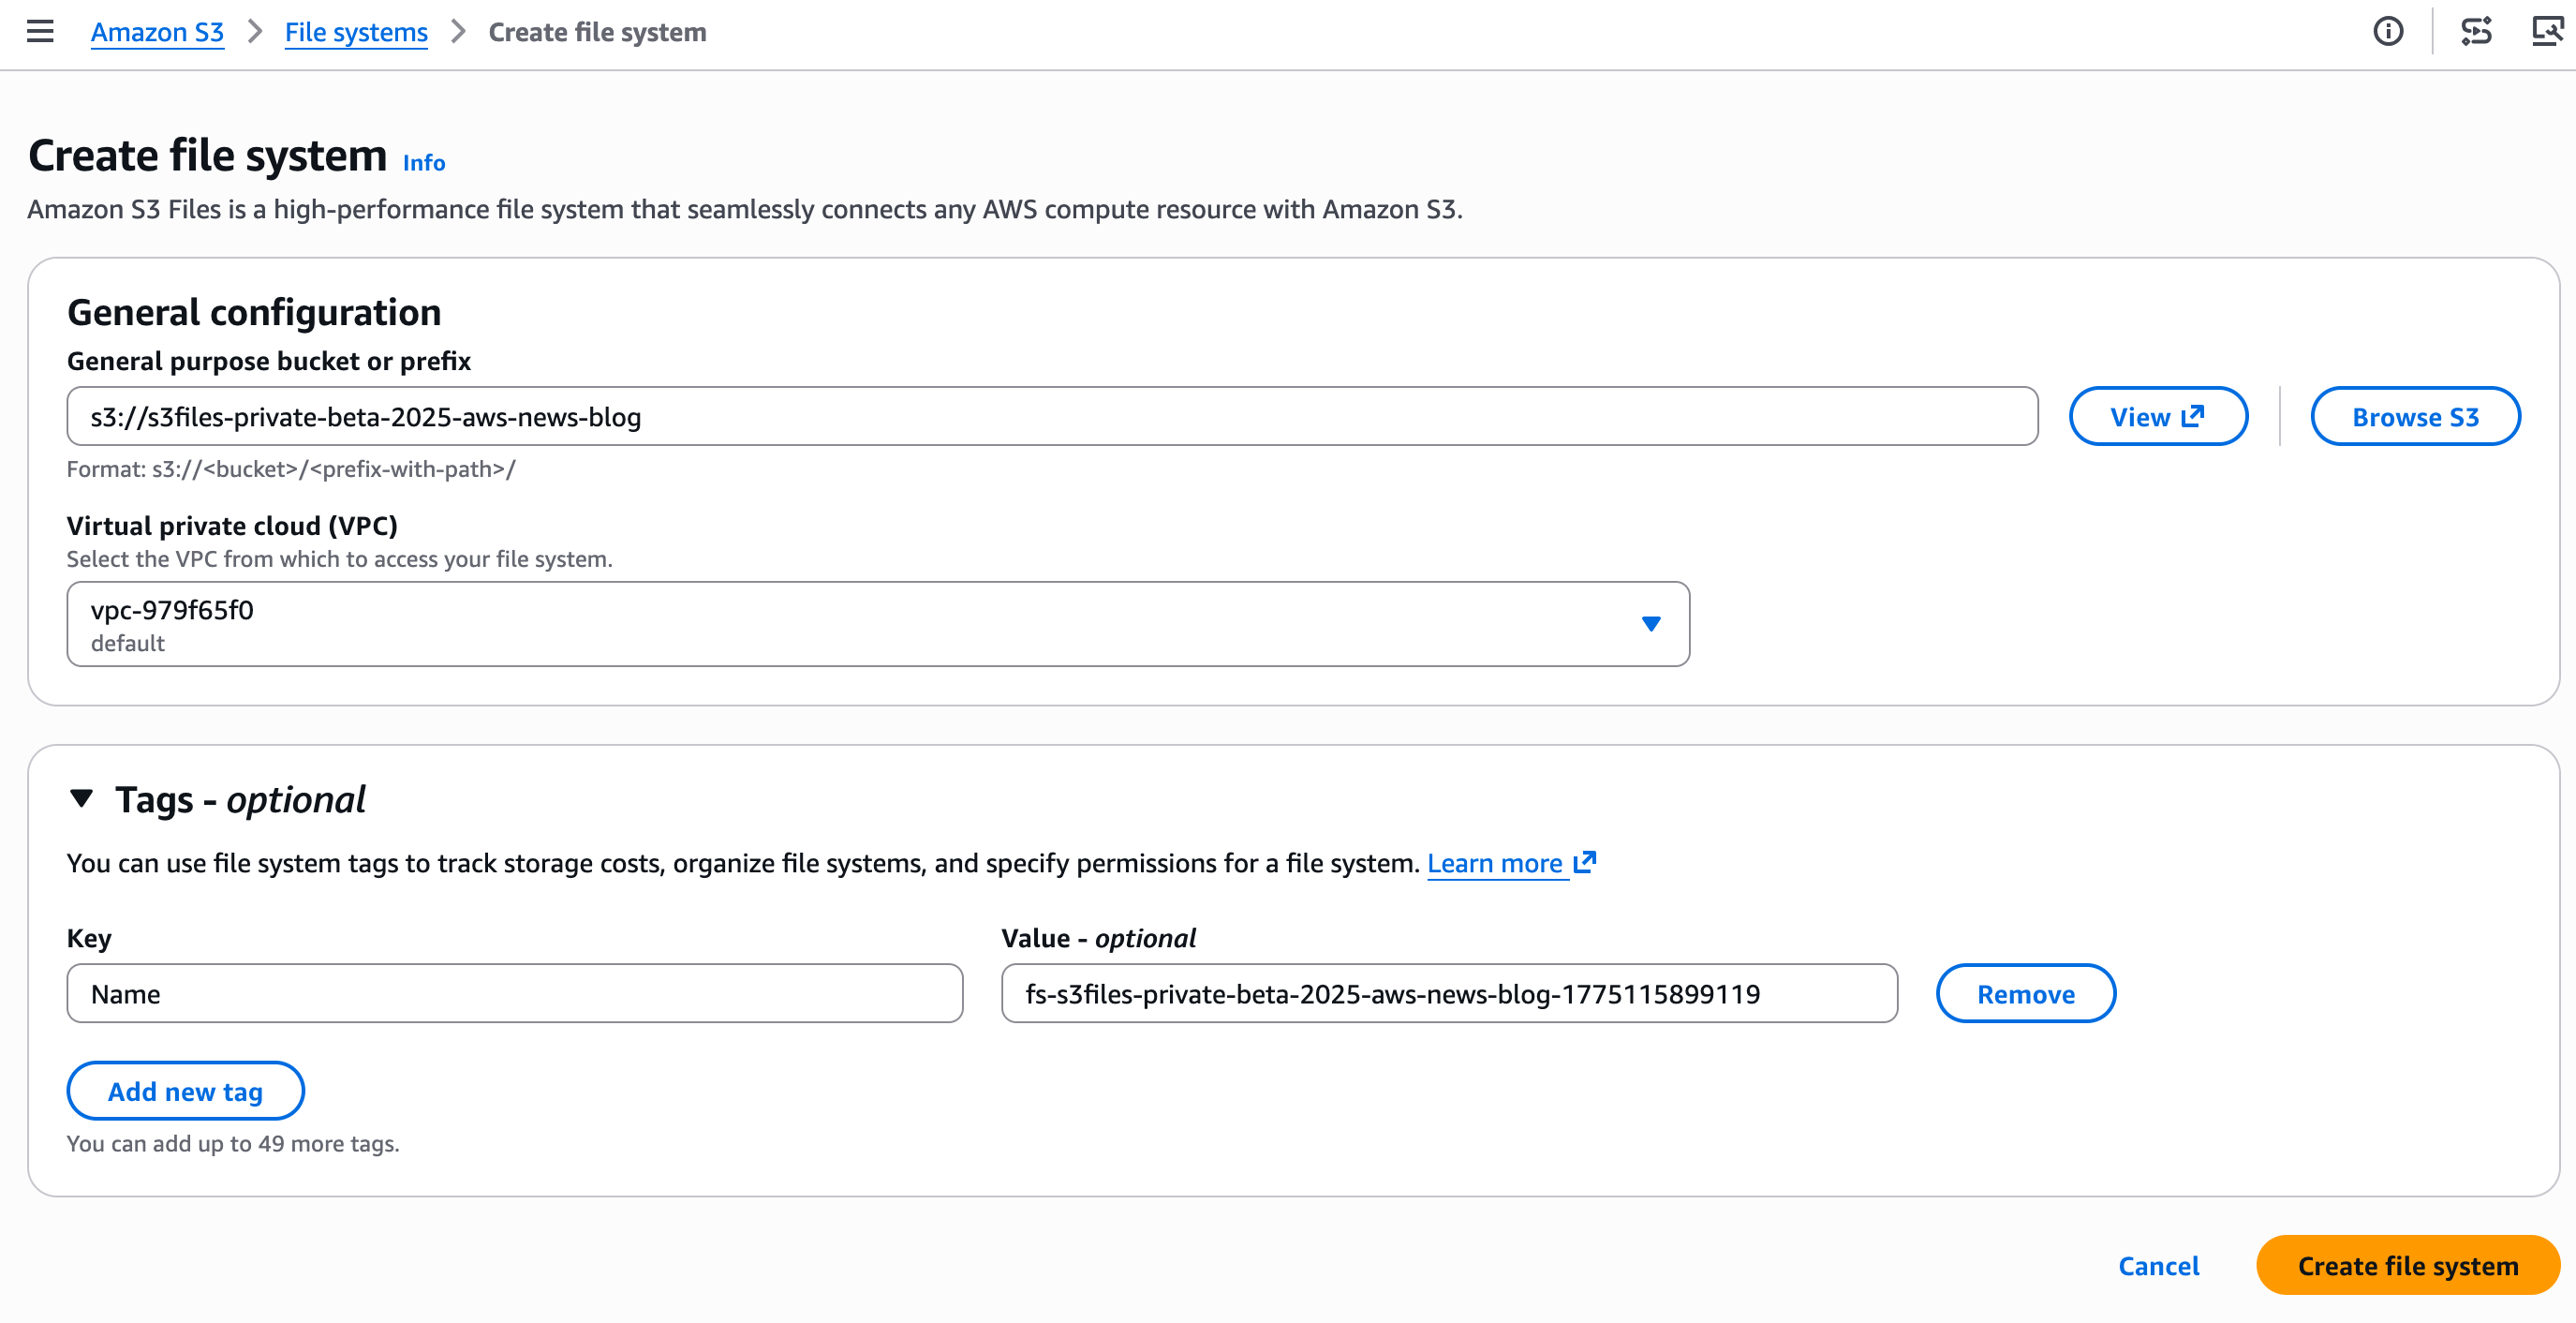
I enter the name of the bucket I want to expose as a file system and choose Create file system.
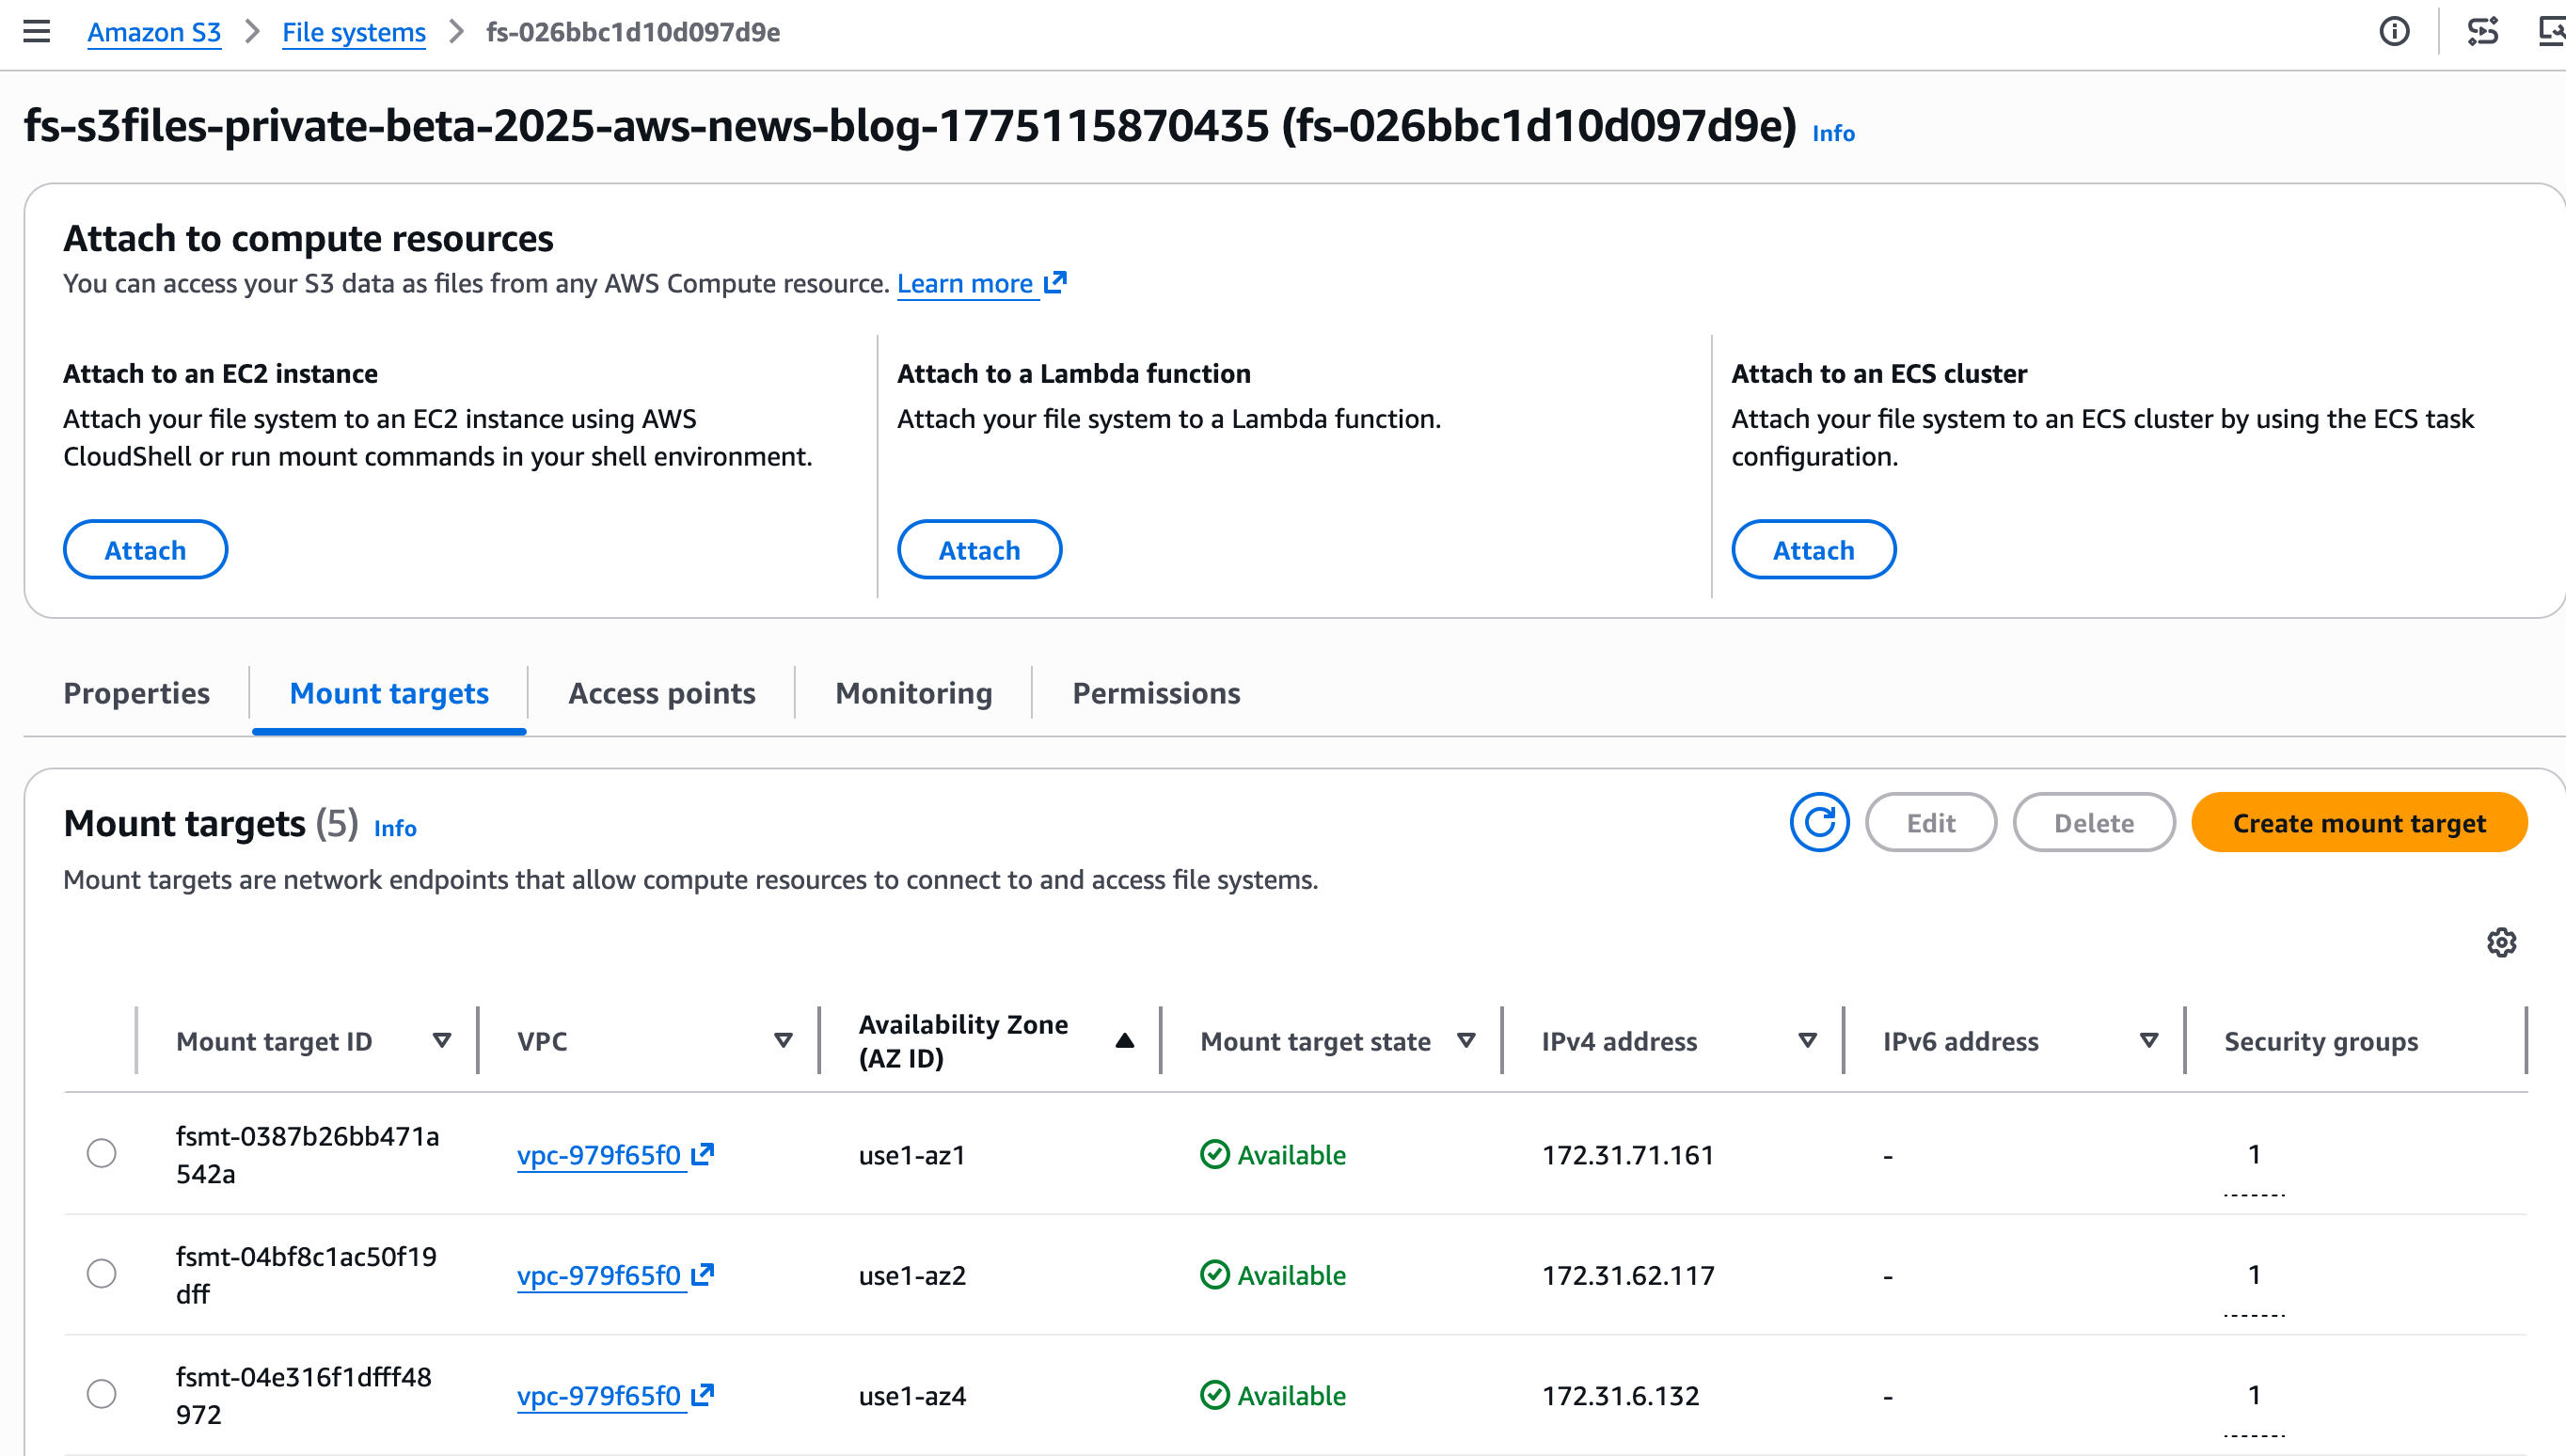
Step 2: Discover the mount target.
A mount target is a network endpoint that will live in my virtual private cloud (VPC). It allows my EC2 instance to access the S3 file system.
The console creates the mount targets automatically. I take notes of the Mount target IDs on the Mount targets tab.
When using the CLI, two separate commands are necessary to create the file system and its mount targets. First, I create the S3 file system with create-file-system. Then, I create the mount target with create-mount target.
Step 3: Mount the file system on my EC2 instance.
After it’s connected to an EC2 instance, I type:
sudo mkdir /home/ec2-user/s3files sudo mount -t s3files fs-0aa860d05df9afdfe:/ /home/ec2-user/s3files
I can now work with my S3 data directly through the mounted file system in ~/s3files, using standard file operations.
When I make updates to my files in the file system, S3 automatically manages and exports all updates as a new object or a new version on an existing object back in my S3 bucket within minutes.
Changes made to objects on the S3 bucket are visible in the file system within a few seconds but can sometimes take a minute or longer.
# Create a file on the EC2 file system
echo "Hello S3 Files" > s3files/hello.txt

# and verify it's here
ls -al s3files/hello.txt
 -rw-r--r--. 1 ec2-user ec2-user 15 Oct 22 13:03 s3files/hello.txt

# See? the file is also on S3
aws s3 ls s3://s3files-aws-news-blog/hello.txt
2025-10-22 13:04:04 15 hello.txt

# And the content is identical!
aws s3 cp s3://s3files-aws-news-blog/hello.txt . && cat hello.txt
Hello S3 Files
Things to know
Let me share some important technical details that I think you’ll find useful.
- S3 Files integrates with AWS Identity and Access Management (IAM) for access control and encryption. You can use identity and resource policies to manage permissions at both the file system and object level.
- Data is always encrypted in transit using TLS 1.3 and at rest using Amazon S3 managed keys (SSE-S3) or customer-managed keys with AWS Key Management Service (AWS KMS).
- S3 Files uses POSIX permissions for files and directories, checking user ID (UID) and group ID (GID) against file permissions stored as object metadata in the S3 bucket.
- Monitor S3 Files using Amazon CloudWatch metrics for drive performance and updates and AWS CloudTrail for logging management events.
- Verify that the latest version of the EFS driver (amazon-efs-utils package) is installed on your EC2 instances. This package is preinstalled on the Amazon Machine Image (AMI) provided by AWS. At the time of writing, you can update it to the latest version.
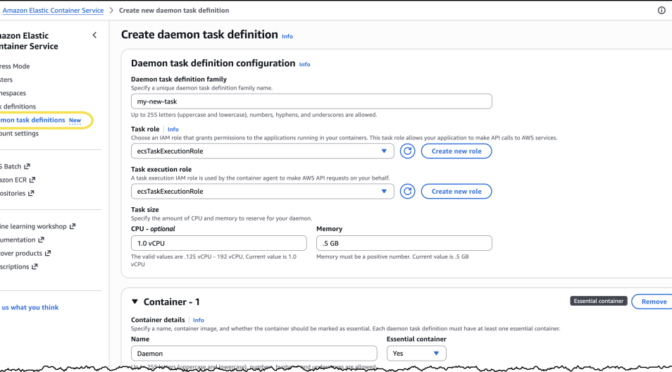
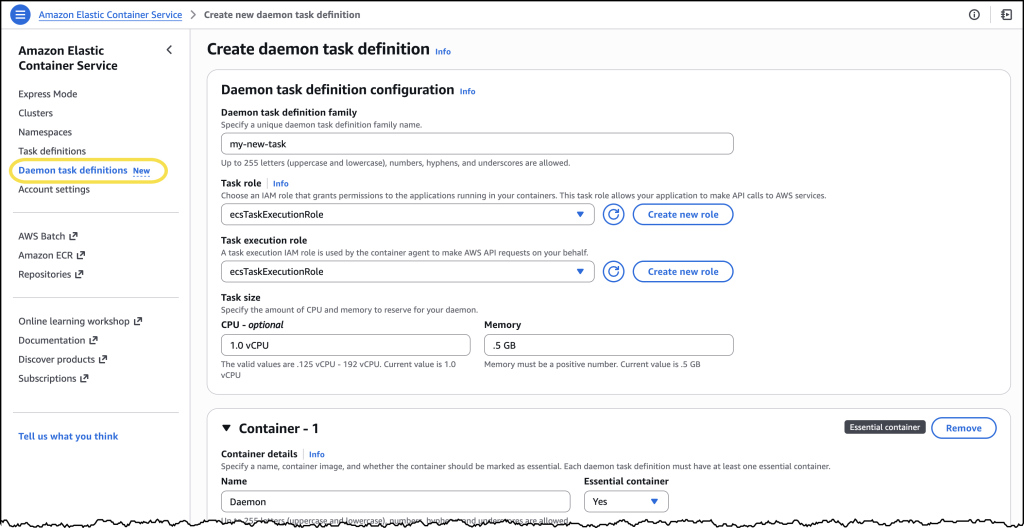
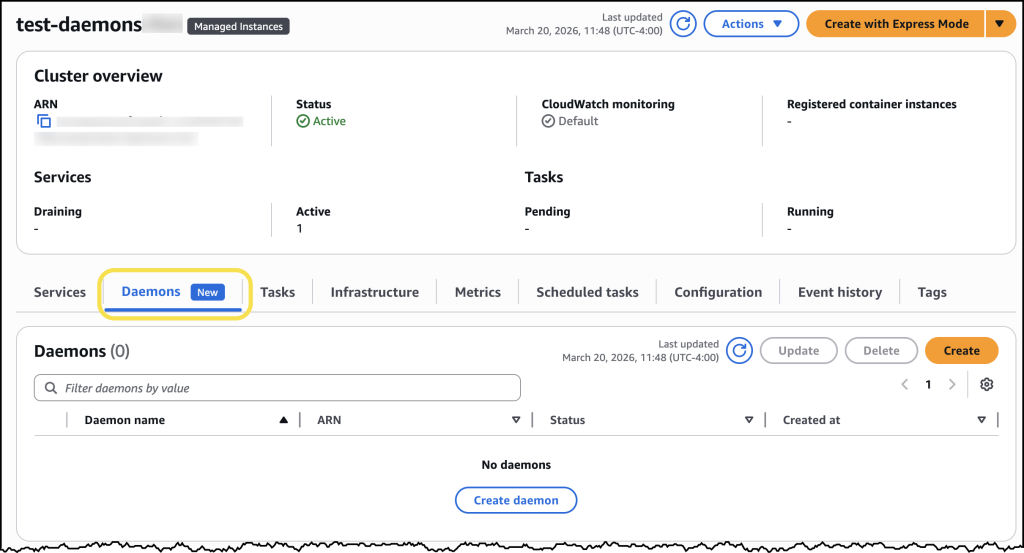
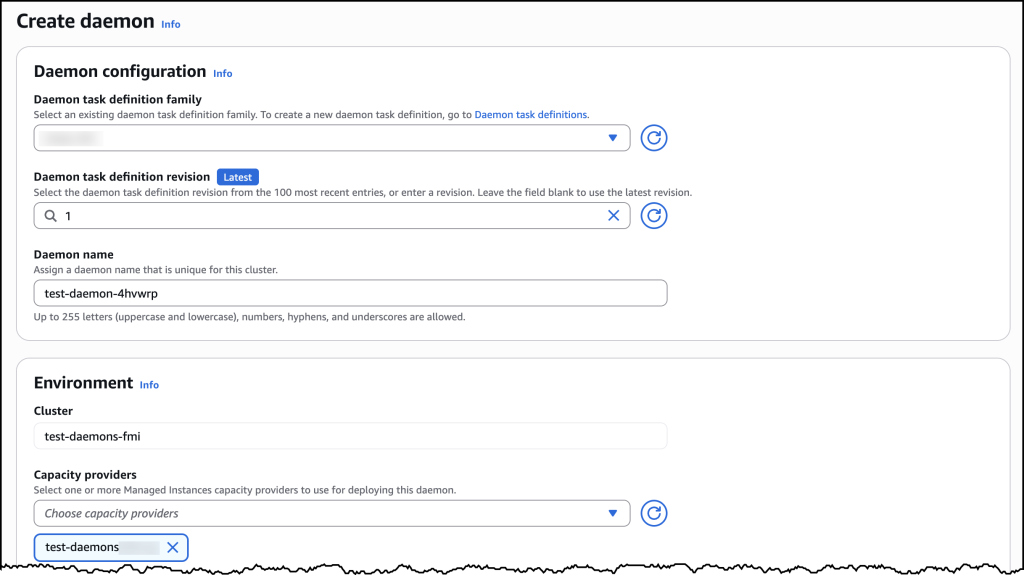
- In this post, I showed you how to use S3 Files from an EC2 instance. You can also mount your S3 bucket as a file system from your ECS or EKS containers, on AWS Fargate or not, and from your Lambda functions.
Another question I frequently hear in customer conversations is about choosing the right file service for your workloads. Yes, I know what you’re thinking: AWS and its seemingly overlapping services, keeping cloud architects entertained during their architecture review meetings. Let me help demystify this one.
S3 Files works best when you need interactive, shared access to data that lives in Amazon S3 through a high performance file system interface. It’s ideal for workloads where multiple compute resources—whether production applications, agentic AI agents using Python libraries and CLI tools, or machine learning (ML) training pipelines—need to read, write, and mutate data collaboratively. You get shared access across compute clusters without data duplication, sub-millisecond latency, and automatic synchronization with your S3 bucket.
For workloads migrating from on-premises NAS environments, Amazon FSx provides the familiar features and compatibility you need. Amazon FSx is also ideal for high-performance computing (HPC) and GPU cluster storage with Amazon FSx for Lustre. It’s particularly valuable when your applications require specific file system capabilities from Amazon FSx for NetApp ONTAP, Amazon FSx for OpenZFS, or Amazon FSx for Windows File Server.
Pricing and availability
S3 Files is available today in all commercial AWS Regions.
You pay for the portion of data stored in your S3 file system, for small file read and all write operations to the file system, and for S3 requests during data synchronization between the file system and the S3 bucket. The Amazon S3 pricing page has all the details.
From discussions with customers, I believe S3 Files helps simplify cloud architectures by eliminating data silos, synchronization complexity, and manual data movement between objects and files. Whether you’re running production tools that already work with file systems, building agentic AI systems that rely on file-based Python libraries and shell scripts, or preparing datasets for ML training, S3 Files lets these interactive, shared, hierarchical workloads access S3 data directly without choosing between the durability of Amazon S3 and cost benefits and a file system’s interactive capabilities. You can now use Amazon S3 as the place for all your organizations’ data, knowing the data is accessible directly from any AWS compute instance, container, and function.
To learn more and get started, visit the S3 Files documentation.
I’d love to hear how you use this new capability. Feel free to share your feedback in the comments below.


 AWS has reached its 20th anniversary! With a steady pace of innovation, AWS has grown to offer over 240 comprehensive cloud services and continues to launch thousands of new features annually for millions of customers. During this time, over 4,700 posts have been published on this blog—more than double the number since